So Much Data, So Little Time: ePlant Steps into the Breach for Plant Researchers
The ever-increasing amount of data available to researchers has come with similarly increasing cognitive loads in efforts to use these data. Even when data sets are stored in well-curated databases, it can be time-consuming to master the specific tools harbored at each site and cumbersome to move between data types. A new tool created by Waese et al. (2017) aims to facilitate hypothesis generation in plant biology by allowing researchers to easily and intuitively move between types and levels of data.
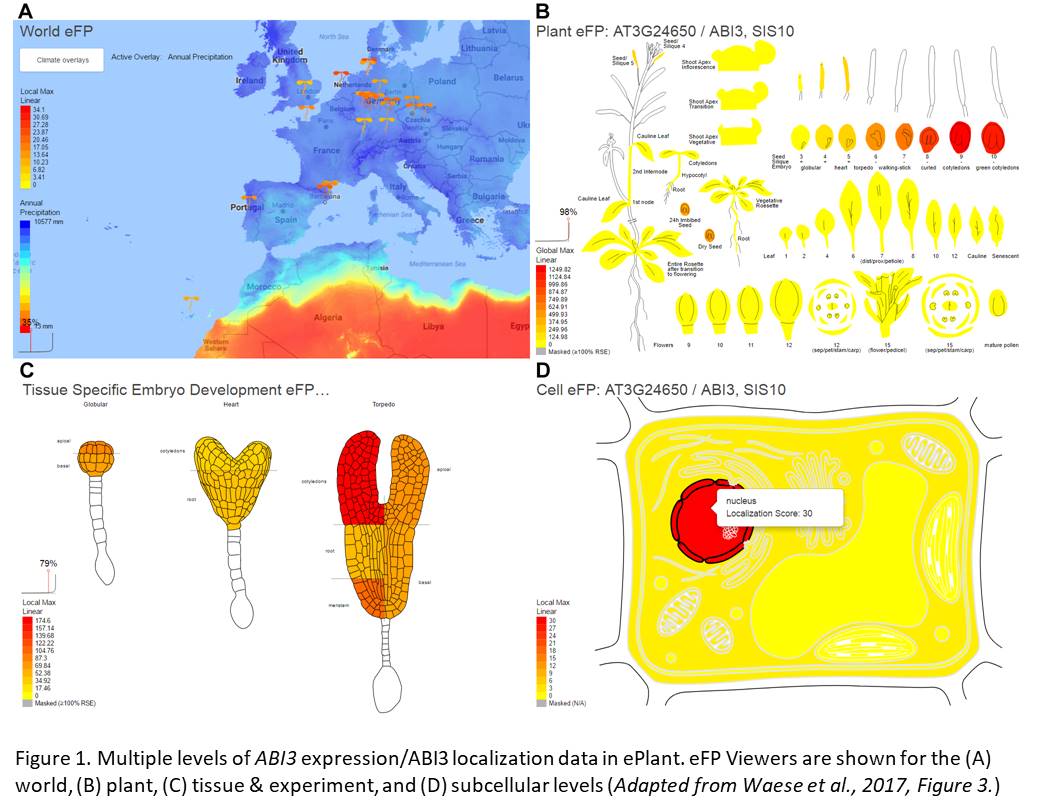
ePlant is a web-based tool that integrates Arabidopsis data from more than 10 sources over a scale of more than 10 orders of magnitude. Waese and coworkers built ePlant to link data on gene expression, subcellular localization (experimental and predicted), protein interactions (with other proteins and with DNA), structural predictions, non-synonymous SNPs, and DNA/RNA sequencing among other types (see figure). As ePlant retrieves each type of data from the databases that house it, ePlant remains as current as the databases themselves. ePlant’s contribution comes in how it links and visualizes the data it retrieves – it feeds data into module “viewers” that are informed by best practices in data visualization and cognitive research (see for example, Speier et al., 2003 and Ware, 2012). In addition, users can easily share specific views with colleagues, so ideas are not lost upon closing a browser. Many visualization tools within ePlant are updates of those currently available within specific databases – often improved with regard to ease of use and data interpretation, or for downstream applications such as generating outputs as vector files that can be used to produce higher quality figures than previous outputs allowed.
For example, expression data are displayed using heatmaps at various scales (see figure). Data can be displayed for one or many genes, to show overall expression patterns or relative levels, depending on the chosen settings. Users can see natural variation of expression on a global scale, with both geographical and climate data, and then look at distribution of expression within a plant during the course of development or in response to various treatments. As users move between levels of data, so-called zoomable user interfaces help users interpret large amounts of information and conceptualize where they are in terms of the scale of the data.
 In addition to the 11 integrated viewers, ePlant also gathers links to external tools for ease of access. The entire project is open source, facilitating the future addition of modules to accommodate new data types and new connections between levels of data. ePlant has been created for and with Arabidopsis data, but efforts are underway to expand it to other plant species. All in all, Waese et al. have provided an exciting and much needed tool that places plant biology at the forefront of information handling and should allow plant scientists to focus on the science rather than on mastering an ever-increasing set of tools.
REFERENCES
Speier, C., Vessey, I., and Valacich, J.S. (2003). The Effects of Interruptions, Task Complexity, and Information Presentation on Computer-Supported Decision-Making Performance. Decis. Sci. 34, 771–797.
Waese, J., Fan, J., Pasha, A., Yu, H., Fucile, G., Shi, R., Cumming, M., Kelley, L., Sternberg, M., Krishnakumar, V., Ferlanti, E., Miller, J., Town, C., Stuerzlinger, W. and Provart, N.J. (2017). ePlant: Visualizing and Exploring Multiple Levels of Data for Hypothesis Generation in Plant Biology. Plant Cell. doi: 10.1105/tpc.17.00073.
Ware, C. (2012). Information Visualization: Perception for Design (Morgan Kaufmann Publishers, San Francisco, CA).


Leave a Reply
Want to join the discussion?Feel free to contribute!