Functional principal component analysis: a robust method for time-series phenotypic data
Molecular breeding relies on careful assessment of phenotypic traits linked to DNA markers so that causal genes can be identified and desirable crop alleles selected. Over the past decade, DNA markers have become abundant with the rapid advancement of next-generation sequencing technology, including whole-genome sequencing and genome-wide marker profiles in diverse germplasms. However, the labor-intensive job of phenotyping, which traditionally depends on the experienced eye of breeders, remains a bottleneck to taking advantage of the massive amount of genomic information. In recent years, high-throughput phenotyping, also known as phenomics, has emerged and thrived. Phenomics brings together imaging and sensor technology, robotics, high-performance computing and artificial intelligence to characterize plant structure and function in various environmental conditions (Tardieu et al., 2017; Zhang et al., 2019). Algorithms and software convert image data into measurable plant traits that can be analyzed accordingly (Gehan et al., 2017; Li et al., 2018; Zhang et al., 2019). The increasing complexity of phenotypic data also demands appropriate statistical methodology (Xu et al., 2018; York, 2019).
 In this issue of Plant Physiology, Miao et al. investigate hyper-temporal image data in genome-wide association study (GWAS). They demonstrate that compared to the analysis of individual time points, functional principal component analysis (FPCA) is a robust statistical approach to analyze phenotypic changes over time. As their focal species, Miao et al. (2020) chose Sorghum bicolor, a drought-tolerant bioenergy crop in the grass family. They focused on plant height as the phenotypic trait, for which several causal loci have been identified, including Dwarf1 (Dw1, encoding a protein in the brassinosteroid signaling pathway), Dw2 (encoding a protein kinase) and Dw3 (encoding an auxin-related transporter). Dw2 is also genetically linked with a flowering-time gene Maturity1 (Ma1).
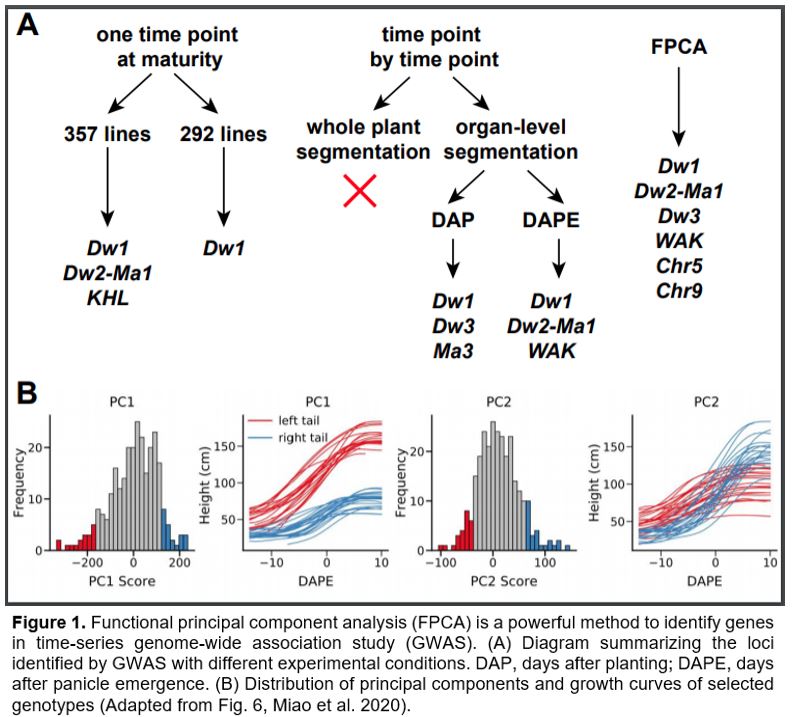
Using a collection of sorghum germplasms, Miao et al. (2020) compared three approaches for plant height measurement and analysis, with each method followed by GWAS (Fig. 1A). They first manually measured plant height at maturity in the field from the base of the plant to the top of panicle using 357 lines, and identified Dw1, Dw2-Ma1 and another known plant-height locus, KHL1. After removing lines that could not be measured under greenhouse conditions (described below) either due to limitations of the maximum height of their imaging facility or poor plant growth, GWAS using the remaining 292 lines retrieved only Dw1 as a significant locus. Neither the full panel nor the remaining population identified Dw3 (Miao et al., 2020).
Next, the authors performed GWAS using greenhouse-grown and automated phenotyped plants in a time-point-by-time-point manner. Due to the limited capacity of the imaging facility, the set of plants was divided in half and measured on alternate days. Nonparametric regression was employed to infer missing data and compare height at each time point. Miao et al (2020) explored two approaches in plant height measurement, whole-plant segmentation and organ-level segmentation. The former method identifies plant and non-plant pixels and measures height from the base to the top of the plant even if the highest point is a leaf tip, whereas the latter method separates different organs and measures the length from the base to the top of the stalk or inflorescence. Since sorghum leaf angle changes during leaf expansion, whole-plant segmentation may measure different parts of the leaf blade at different developmental stages and thus may be inaccurate. Accordingly, organ-level segmentation was used in subsequent experiments. The authors further compared plant age calculated as days after planting versus that calculates as days after panicle emergence. Combining results from different time points, they identified Dw1, Dw3 and a photoperiod-sensitive gene, Ma3 (Childs et al., 1997) with the days-after-planting method. With the days-after-panicle-emergence method, they identified Dw1, Dw2-Ma1 and another known locus WAK on chromosome 3 (Fig. 1A) (Miao et al., 2020).
Last but not least, FPCA was employed to decompose the variation among the nonparametric curves. The first two functional principal components explained >97% of total variation and thus were used for GWAS. The first principal component (PC1) describes height variation that is consistent over time, while PC2 reflects growth rates that vary between developmental stages (Fig. 1B). While the GWAS using PC1 data identified Dw1, Dw2-Ma1 and WAK, GWAS with PC2 identified Dw3 and two novel loci on chromosomes 5 and 9, respectively. Together, the FPCA method identified most of the known loci controlling sorghum height and additional novel loci (Fig. 1A). The fact that different loci were recovered from different PCs may reflect distinctive mechanisms of these genes controlling plant height. Furthermore, the single nucleotide polymorphisms nearest to the significant loci are generally closer to the known responsible genes, further supporting greater accuracy and precision of the FPCA method.
In conclusion, time-series data are crucial for studying plant developmental dynamics and plant–environment interactions, and become easier to acquire with the advance of high-throughput phenotyping. Compared to single time-point comparisons, FPCA confers greater power in gene identification in time-series GWAS regardless of missing data, and may be applicable in a wide range of time-series phenotypic data analyses.
Yunqing Yu
Assistant Features Editor
Donald Danforth Plant Science Center
Saint Louis, MO, USA
References
Childs KL, Miller FR, Cordonnier-Pratt M-M, Pratt LH, Morgan PW, Mullet JE (1997) The sorghum photoperiod sensitivity gene, Ma3, encodes a phytochrome B. Plant Physiology 113: 611-619
Gehan MA, Fahlgren N, Abbasi A, Berry JC, Callen ST, Chavez L, Doust AN, Feldman MJ, Gilbert KB, Hodge JG (2017) PlantCV v2: Image analysis software for high-throughput plant phenotyping. PeerJ 5: e4088
Li M, Frank MH, Coneva V, Mio W, Chitwood DH, Topp CN (2018) The persistent homology mathematical framework provides enhanced genotype-to-phenotype associations for plant morphology. Plant Physiology 177: 1382-1395
Tardieu F, Cabrera-Bosquet L, Pridmore T, Bennett M (2017) Plant phenomics, from sensors to knowledge. Current Biology 27: R770-R783
Xu Y, Qiu Y, Schnable JC (2018) Functional modeling of plant growth dynamics. The Plant Phenome Journal 1:1-10
York LM (2019) Functional phenomics: an emerging field integrating high-throughput phenotyping, physiology, and bioinformatics. Journal of Experimental Botany 70: 379-386
Zhang Y, Zhao C, Du J, Guo X, Wen W, Gu S, Wang J, Fan J (2019) Crop phenomics: current status and perspectives. Frontiers in Plant Science 10: 714