Simulation modeling platform provides a powerful tool for identifying optimal traits and management practices for wheat production
Author: Robert P Skelton1
Affiliation: Dept. of Integrative Biology, University of California Berkeley, Berkeley, CA, 94720, USA
Global demand for food security places an emphasis on a need to improve crop yield. The complexity of plant development and its interaction with dynamic growing environments and management practices challenges our ability to select optimal crop genotypes based solely on yield, placing a significant emphasis on identifying structural and functional plant traits that influence yield but are less influenced by environment and more closely associated with the genotype. Despite substantial advances in ground-based, high-throughput phenotyping platforms (White et al., 2012; Sankaran et al., 2015), data bottlenecks persist due to the large number of potential traits (e.g., sometimes up to 50 for wheat), thus limiting our ability to predict the best traits and management practices for optimal growth (White et al., 2012; Salas Fernandez et al., 2017). In this volume of Plant Physiology, Liu and Baret illustrate how simulation modeling can provide a powerful and heuristic tool for helping to integrate and summarize much of the available phenotypic data to identify a smaller range of plant traits and management practices that might improve future wheat (Triticum aestivum) yield.
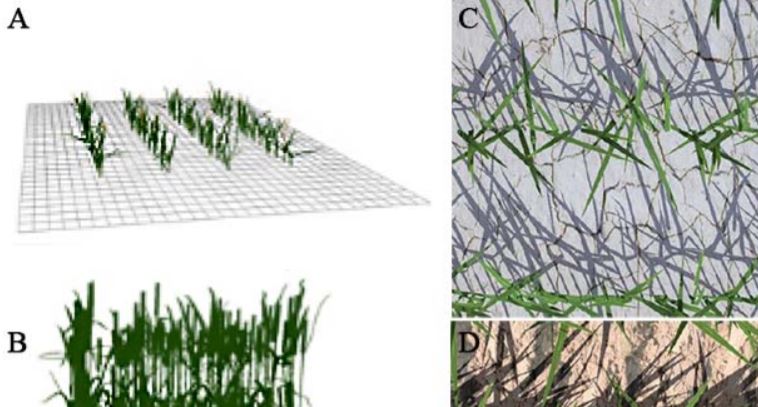
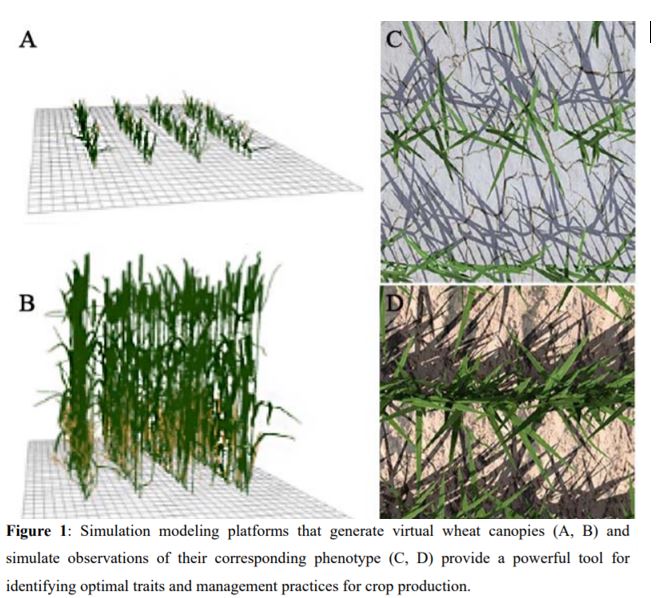 Liu and Baret (2019) present a digital plant phenotyping platform (D3P) that generates virtual wheat canopies (Fig. 1A, B) and simulates observations of their corresponding phenotype (Fig. 1C, D). The virtual canopy structure model incorporates several management practices, certain environmental conditions, as well as wheat architectural traits that control canopy development from emergence to the beginning of stem elongation. Based on prior experiments, Liu and Baret had been able to reduce the number of parameters required by the structure model for wheat to five parameters that drive wheat structure dynamics before tilling starts and five additional parameters that drive tiller development and leaf senescence during the tillering phase. In addition, each different wheat canopy is simulated at ten time points—five before tillering and five after tillering—thus adding a temporal component to the phenotyping platform (e.g., Figure 1A, B represent two different time periods). The simulated observations are meant to mimic those obtained from LiDAR and multispectral and RGB cameras (Figure 1C, D), and can be used to quantify Green Fraction, the proportion of each image of the canopy that is photosynthetic (i.e., contributes to yield). Liu and Baret (2019) use the Green Fraction values to train a machine learning algorithm to identify traits that optimize wheat performance.
To demonstrate the utility of their phenotyping platform, Liu and Baret (2019) ran simulations of virtual wheat canopies generated using 2500 different combinations of the five initial traits randomly sampled from a normally distributed trait database. Observations of virtual canopies were “captured” at each time point from five view directions, generating a large number of snapshots (2500 simulations x 10 time points x 5 views = 125 000 snapshots). These snapshots provide a database of “pseudo-observations” that allow Liu and Baret (2019) to train their model and assess its accuracy. By showing that the D3P modelling platform provides an accurate assessment of the known wheat phenotypic traits and can reliably assess the Green Fraction, Liu and Baret (2019) accomplish their goal of identifying traits that under particular management practices and environmental conditions have the potential to optimize wheat yield.
The future looks promising for data-driven plant breeding and crop improvement, but there is still plenty of work to be done. Linking the optimal simulated plants to known databases of wheat genotypes seems to be an important and obvious next step. Identifying genotypes that are associated with the different trait parameters in the modeling platform will ensure that the model can be applied to field trials where it can be tested using actual observations to avoid possible systematic modelling error. It will be equally important to ensure that different growing environments are accounted for. For example, it will be crucial to test whether the relatively few traits in the modelling platform can accurately capture wheat performance in warm and dry environments or whether additional functional traits should be considered (Araus et al., 2012). Finally, training the model on other crop species might have important benefits.
References
Araus JL, Serret MD, Edmeades GO (2012) Phenotyping maize for adaptation to drought. Front Physiol 3 AUG: 1–20
Liu S, Baret F (2019) High throughput plant traits estimation using D3P. Plant Physiol. https://doi.org/10.1104/pp.19.00554
Salas Fernandez MG, Bao Y, Tang L, Schnable PS (2017) A high-throughput, field-based phenotyping technology for tall biomass crops. Plant Physiol. doi: 10.1104/pp.17.00707
Sankaran S, Khot LR, Carter AH (2015) Field-based crop phenotyping: Multispectral aerial imaging for evaluation of winter wheat emergence and spring stand. Comput Electron Agric 118: 372–379
White JW, Andrade-Sanchez P, Gore MA, Bronson KF, Coffelt TA, Conley MM, Feldmann KA, French AN, Heun JT, Hunsaker DJ, et al (2012) Field-based phenomics for plant genetics research. F Crop Res 133: 101–112