Frédéric Bouché, a postdoctoral research with Richard Amasino at the University of Wisconsin, recently caught our attention when he published a set of impressive visual abstracts to support his latest research papers. We invited him to share how and why he makes these images. -Editors
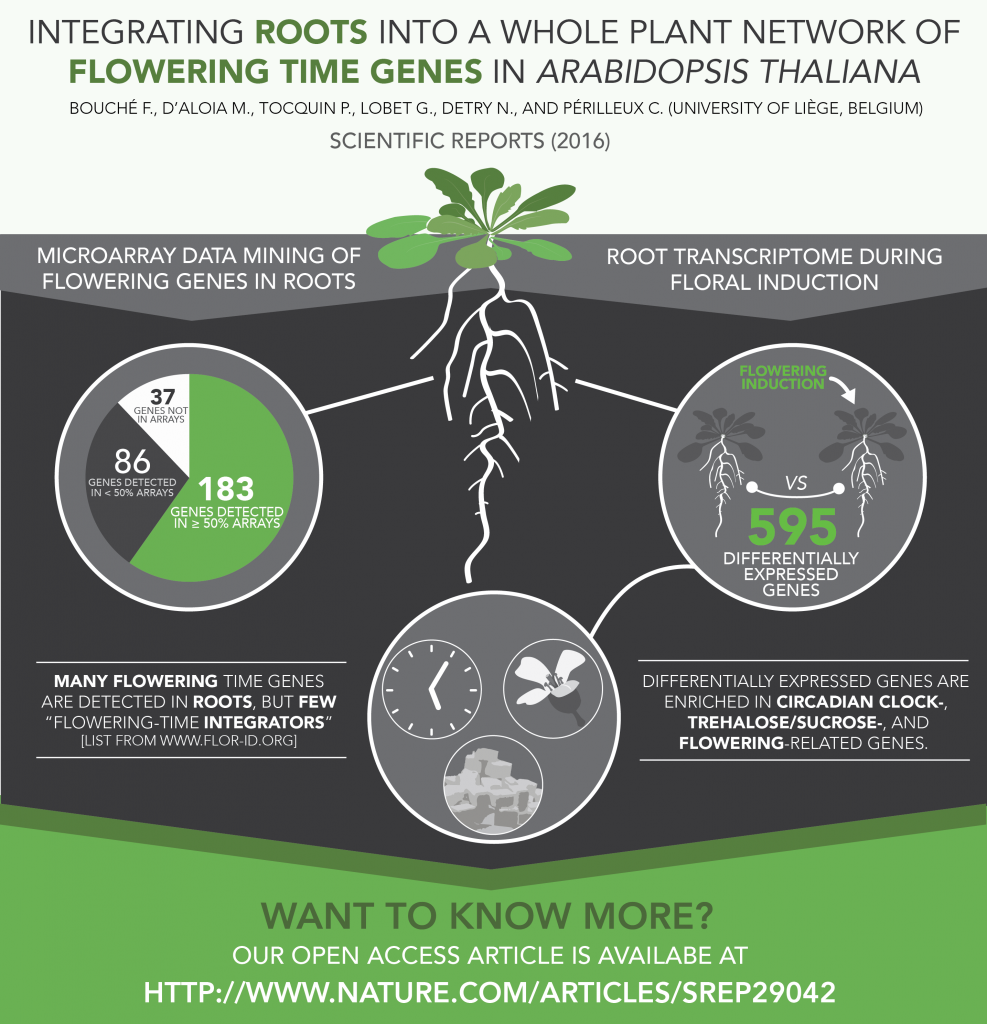
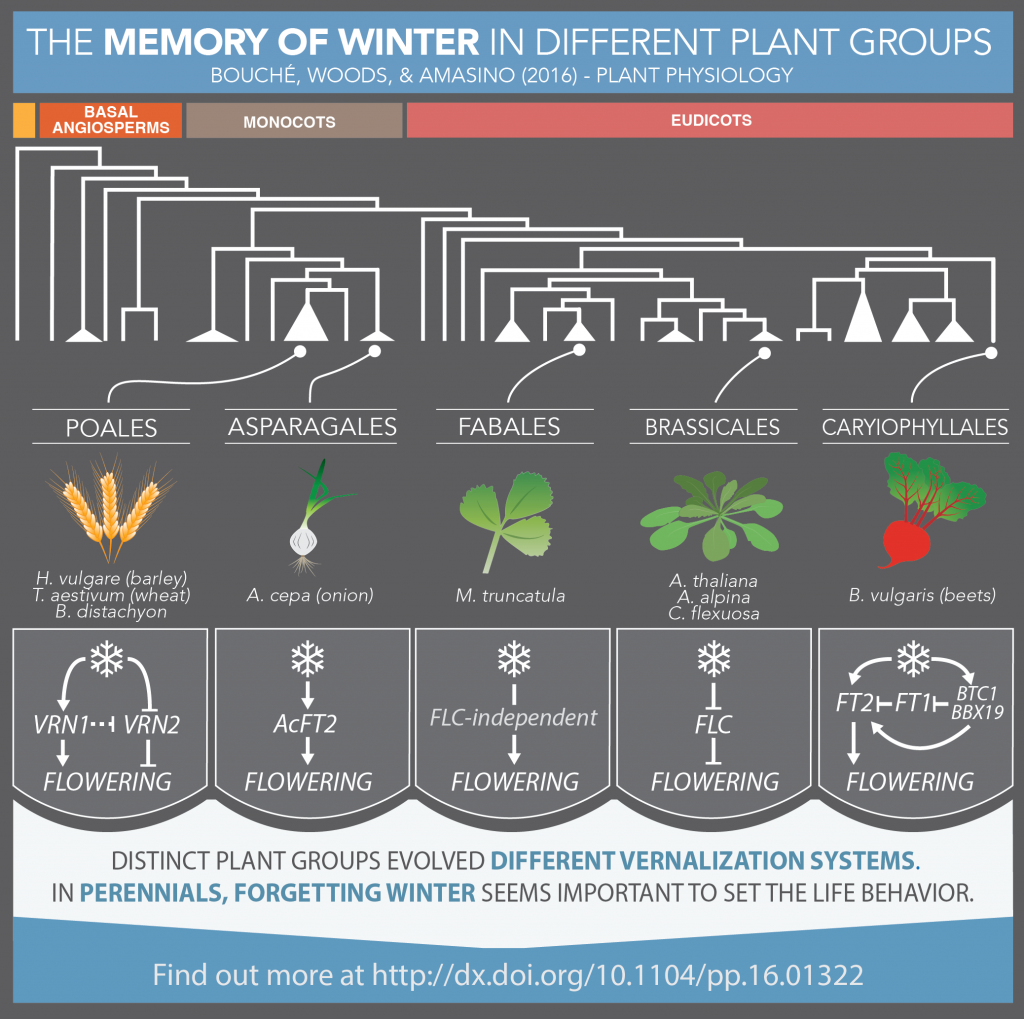
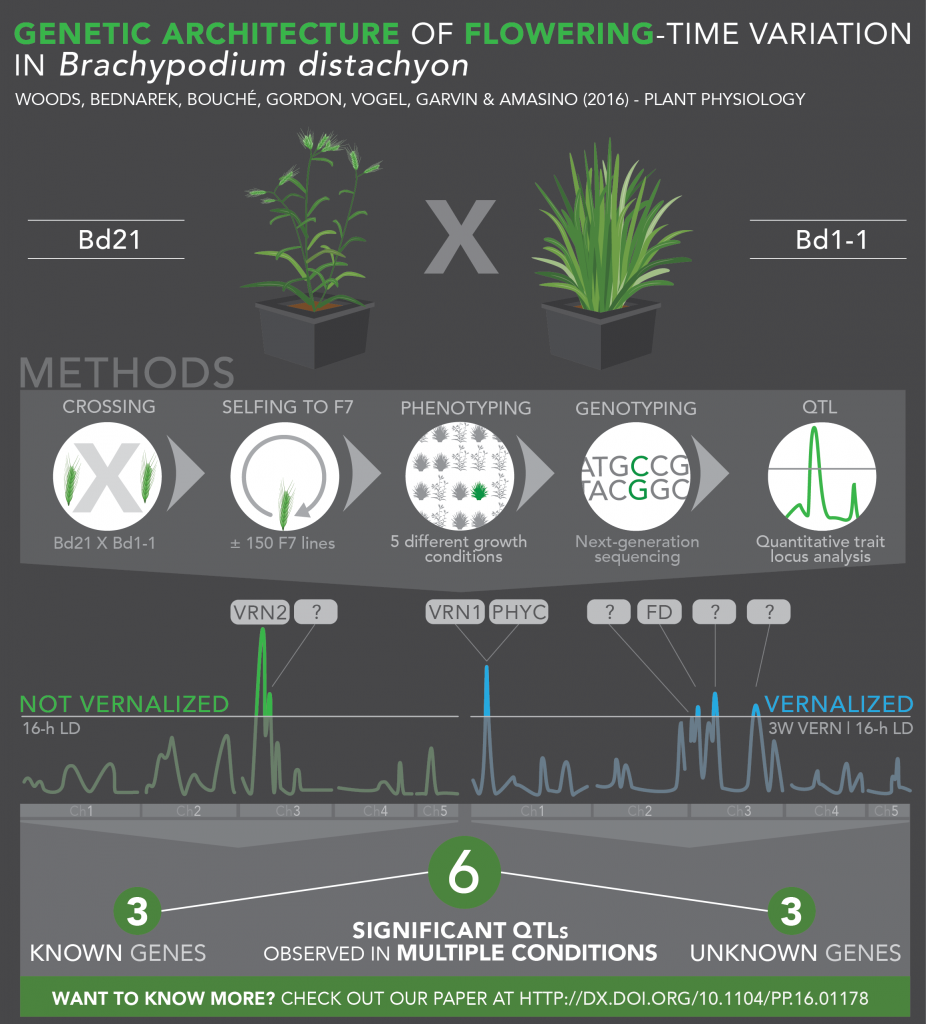
When you work hard, and your scientific work is finally out, you want to reach out the science community. However, scientists are busy; to catch their attention, you need to communicate efficiently. Summarizing your research in a graphical abstract/infographic is a fantastic way to grab the attention of many readers. I love reading graphical abstracts, and even if the work is outside my field of expertise, it helps grasp the take home messages. Hence, I decided to advertise my scientific outputs in a similar way, so that people can learn about what we are doing within a few seconds. Then, it is up to them to check out our article if they want to get more information about the methodology and results. Posted below are a few infographics I created that summarize my recent papers.
To draw the infographics, I use a vector-based program called Adobe Illustrator. For those who do not have access to this app through their institution, there are free alternatives, such as Inkscape. Many scientists are familiar with these programs, as they use them to create final versions of their article figures. Instead of using a grid of pixels, the vector-based programs schemes are drawn using paths (line, square, custom shape, etc.) associated with attributes (e.g. color, width, etc). Schemes are thus encoded in a mathematical format, though you only see the graphical output of it. The great side of it is that vector-based images can be scaled up without losing resolution. The PDF format is one example of vector-based graphics: you can zoom as much as you want on the text of a PDF, you will not see any pixels. It is because the letters are made of vectors, not pixels. Using such format for your infographics has several advantages, as they are scalable, create smaller file sizes, and allow you to export your image in various file formats.
Though these programs are complicated and not very intuitive, anyone can get great results after some practice. I do not have any academic training in graphic design/drawing. To get started, I did a two-day Illustrator training provided by my university. Such training is freely available in many universities and will give you the basic knowledge about vector graphic design. Afterward, just have fun and practice. Having a concrete goal in mind helps. In my case, I wanted to draw complex Arabidopsis gene networks. At first, my drawings were ugly, but I kept working and ended up with more satisfying results. By taking advantage of the vector-based graphics format, we could add interactivity to these schemes. With Guillaume Lobet, we ended up creating a database of the networks controlling flowering in Arabidopsis thaliana, called FLOR-ID (http://www.flor-id.org).
You might argue that it could be easier to incorporate clipart elements instead of drawing them. I never do it, for two reasons; the first one is that I do not want to worry about copyrights (though you can refine your Google Image research parameters to find free to reuse and/or modify pictures). The second one is that available clip arts most often do not suit my needs, and they do not offer any flexibility. So, let’s draw what we need!
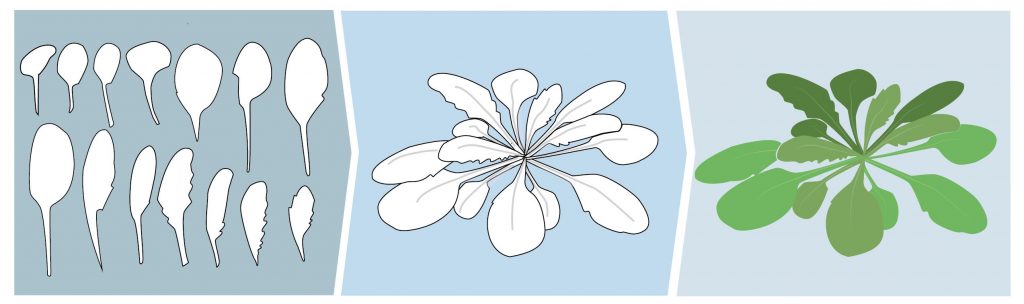
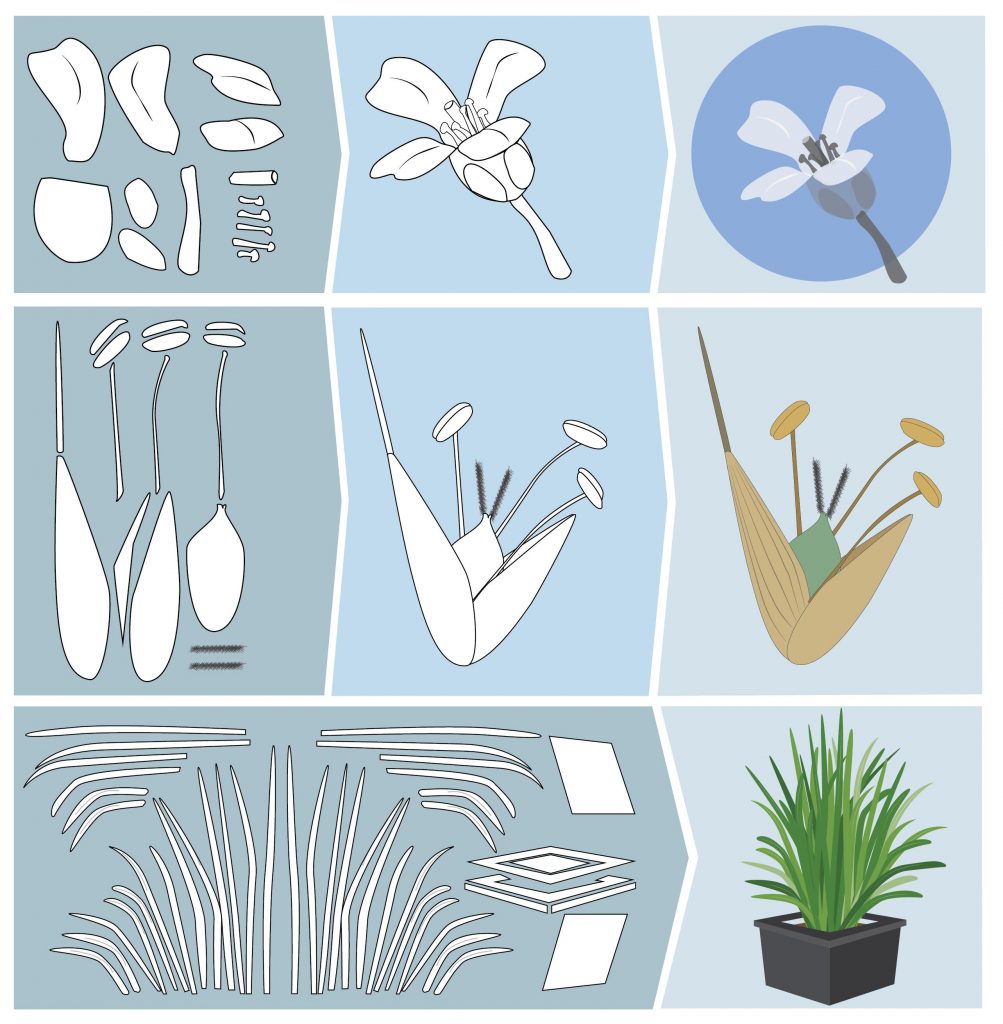
One thing to keep in mind is that almost every complex-looking object is made up of simple parts. For instance, the Arabidopsis shoot is made up of leaves that have simple shapes. Use your favorite Arabidopsis picture, import it in your vector-based program, and use it to draw the form of one leaf; then, duplicate it, change its size, orientation, color, and assemble the leaves to create a “complete” rosette. Using such a method will help you to create nice-looking schemes. You just have to do it once per species, then adapt the look of your plant according to your needs: add an inflorescence? A bigger root system? No problem!
Now, what are the key steps to draw an infographic:
- Before starting, look at infographics on the web to get some inspiration and have an idea of the output you want.
- To not try to fit all the results of your article in the infographic. First, identify the take-home message(s). Keep it as simple as it can be without compromising scientific data. What are the key methodological elements used in the study to reach this result? Try to stay as concise as possible and put yourself in the mind of a reader unfamiliar with your research topic.
- Limit your infographic to four/five colors (the free Adobe Kuler online tool helps you to find matching colors), including one or two eye-catching colors that you will use to highlight key data.
- Limit the amount of text. Ideally, use only complete sentences for the take home message.
- Carefully choose your font. Try to favor “sans ms” fonts (e.g. Myriad Pro, Avenir, Futura, etc.), especially for titles. Do not use more than two fonts and use different weights of fonts in the same family (e.g. key information in bold).
- Do not overcharge the infographic. You can leave “empty space” around data to draw attention to them; photographers are familiar with this concept, known as “negative space.”
- Try, try, try. Vector-based programs allow you to have several workspaces opened at the same time. I duplicate my workspace all the time and try new things. You can also use the “save version” function, which allows you to keep intermediate versions of the work. The modifications you just did are ugly? Just go back to the previous version!
- When you are done, show the infographics to your colleagues and also with people less familiar with your topic. They represent the public you target, so take their comments into account.
- Now, let’s communicate! Twitter, Facebook, or any social media are great places to share your infographics. You can also print it, use it as a graphical abstract for the online version of your manuscript, etc.
There’s no doubt that people are drawn to graphic images, and that learning how to communicate your science visually is becoming a necessary skill for scientists. Thanks to Frédéric for sharing his secrets and for the great examples of what we can do with the tools we have available.
Connect with Frédéric on Twitter to learn more!
 Abstract: The enormous species diversity of the flowering plants has puzzled evolutionary biologists since Darwin’s day. The rapid radiation of the flowering plants can be attributed at least in part to their recruitment of insects as vectors for their pollen, and the subsequent reproductive isolation that arose between populations with different floral morphologies. Understanding the relationships between flowers and their pollinators is important not only in understanding the rapid radiation of the angiosperms, but also in devising strategies to optimise yield of key insect-pollinated food crops such as fruits, legumes and oilseeds. In this talk I will discuss our recent research into how petal morphology influences pollinator behaviour and plant evolution. The petal surface affects the optical properties of the flower, its temperature and the way it feels to foraging insects. I will describe how floral features such as the velvety surface of the petunia petal, the iridescent petals of tulips and the insect-mimicking petal spots of daisies are built, how these features influence pollinator behaviour, and how our work is beginning to define the molecular changes underpinning their evolution.
 Feeding the world (and saving nature) in this populous century, Jane Langdale began, depends entirely on agricultural efficiency—the ability to turn a given amount of land and sunlight into ever more food. And that depends on three forms of efficiency in each crop plant: 1) interception efficiency (collecting sunlight); 2) conversion efficiency (turning sunlight into sugars and starch); and 3) partitioning efficiency (maximizing the edible part). Of these, after centuries of plant breeding, only conversion efficiency is far short of the theoretical maximum. Most photosynthesis (called “C3“) is low-grade, poisoning its own process by reacting with oxygen instead of carbon dioxide when environmental conditions are hot and dry.
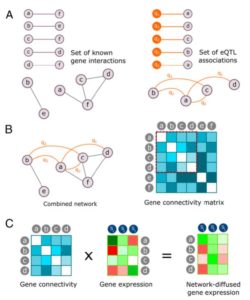 Eucalypts are fast-growing trees increasingly exploited for pulp, paper, bioenergy and other wood-based products. Using genetics tools and a network-based data integration (NBDI) approach, Mizrachi et al. explore a segregating Eucalyptus hybrid population for genes and pathways underlying biomass / bioenergy traits. Their analysis produced an expression QTL (eQTL) map and molecular networks associated with various traits such as wood density and lignin content. Furthermore, they were able to link genes to complex traits, opening the door to the genetic improvement of plant biomass to support a sustainable, bio-based economy. Proc. Natl. Acad. Sci. USA
  One of the many ways that Xanthomonas bacteria manipulate their host plants is by the production of transcription activator-like (TAL) effectors, which the bacterium introduces into the host cell where they alter gene expression in the host nucleus. Schwartz et al. investigated the targets of the TAL effector AvrHah1 produced by the pathogen Xanthomonas gardneri by comparing transcriptomes of plants infected with bacteria producing the effector versus those not producing the effector. Two genes encoding bHLH transcription factors were found to be direct targets of the TAL effector, and a gene encoding a pectate lyase was found to be a target of those bHLH factors. Pectate lyase activity promotes water uptake in the apoplast, presumably through cell wall modification. As water-soaked lesions are a symptom of Xanthomonas infection and thought to contribute to an environment suitable for pathogenesis, this study links the bacterial effector with a susceptibility gene. Proc. Natl. Acad. Sci. USA
 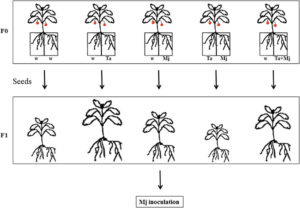 Root-knot nematodes including Meloidogyne javanica are major agricultural pests. Previous studies have shown that biocontrol agents including species of the fungal genus Trichoderma interfere with root-knot nematode pathogenicity, directly through effects on the nematode, and indirectly through a stimulation of plant defenses (priming). Medeiros et al. investigated the mechanism of priming by Trichoderma atroviride, using a tomato split-root system in which the pathogen and biocontrol agent could be inoculated seperately or together. In roots exposed to the nematode, there was an enhancement of resistance when the fungus was co-inoculated or inoculated on the other root half as compared to the no-fungus control, indicating direct and indirect biocontrol effects. Furthermore, the defense enhancement conferred by the fungus was passed on to the progeny; all of the progeny of plants treated with the biocontrol fungus showed enhanced control of the nematode. The mechanism of this heritable priming, which presumably involves epigenetic changes, is yet to be determined. Scientific Reports
 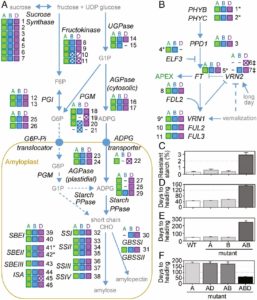 One of the big challenges of working with wheat, as compared to rice, is that the wheat we eat is polyploid; bread wheat (Triticum aestivum) is hexaploid (six copies of each gene) and pasta wheat (Triticum turgidum) is tetraploid (four copies each). Polyploidy makes forward genetics difficult; knocking out one gene rarely leads to phenotypic change due to the masking effect of all the others. Krasileva et al. developed a wheat exome (coding region) capture platform that enabled them to examine more than 10 million mutations, which they mapped to genes. The authors have made these data publically available along with corresponding primers and seed stocks . These resources will be invaluable for both basic researchers and breeders. Proc. Natl. Acad. Sci. USA
 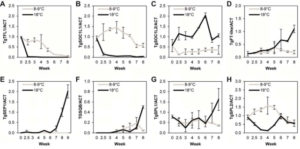 Cultivation of Tulipa gesneriana (tulip), an economically important species due to its ornamental value, can be affected by warming winters, leading to low quality flowers produced out of season. Leeggangers et al. have sequenced RNA and used top-down and bottom-up approaches in tulips grown in two contrasting environments (cool and warm temperatures) to shed light on the molecular network underlying flowering induction and to study how temperature could affect such a network. With both approaches, the authors have identified several temperature-responsive genes that could be regulating the timing of the transition between vegetative and reproductive growth, some of them similar to known components of the Arabidopsis flowering pathway. The expression of some of these genes differs in cultivars with different temperature susceptibilities and correlates with phase transition, providing important information to develop tools for cultivar improvement and climate change adaptation. (Summary by