Get Your Message Across: A Guide to Artwork and Illustrations for Better Impact and Clarity
This PlantBio20 workshop, organized by the ASPB Publications, covered the production of figures, artwork, illustrations, and posters that effectively convey information and complex concepts. The workshop consisted of three presentations on principles of good design, using R/Python to generate complex data figures and software and other resources that can be used to produce effective figures and posters. Pointers on fonts, colors, density of data, and design of graphs for publication were presented. The presentations were followed by a question & answer period, moderated by Plant Direct Editor-in-Chief Ivan Baxter @BaxterTwi.
SPEAKERS
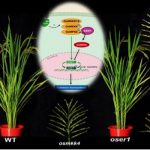
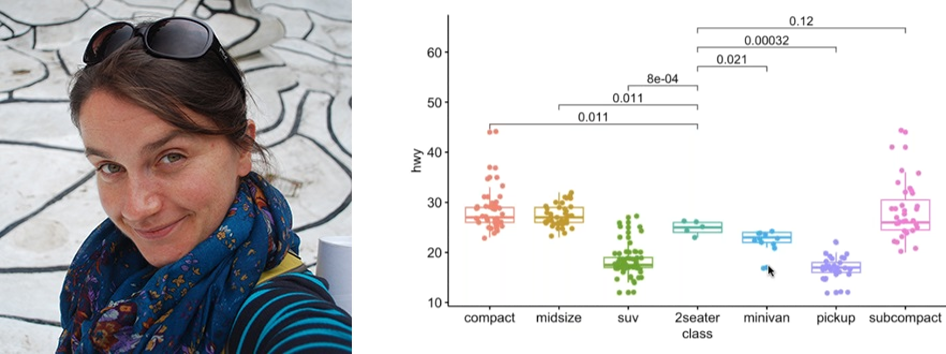
Magdalena Julkowska has just finished a postdoc at KAUST working with Mark Tester and is starting her new position as an Assistant Professor at the Boyce Thompson Institute. She focused on how to layer numbers into a visual representation of data, and talked about the different tools available for data presentation and sources for inspiration. She also discussed how to represent the data as transparently as possible, while still making sure that the message of your graphs is clear. Follow her at @mmjulkowska. You can access her slides on figshare here.
Patrice Salome is a Science Editor for The Plant Cell with a strong interest in visual design. Previously, he was a postdoc with Sabeeha Merchant at UCLA. He spoke about figure basics: figure size, panel placements, color choice (with focus on colorblind-friendly palettes), the types of data and the best way to visualize them, and touched briefly on how to save figures the easy way. You can access his slides here.

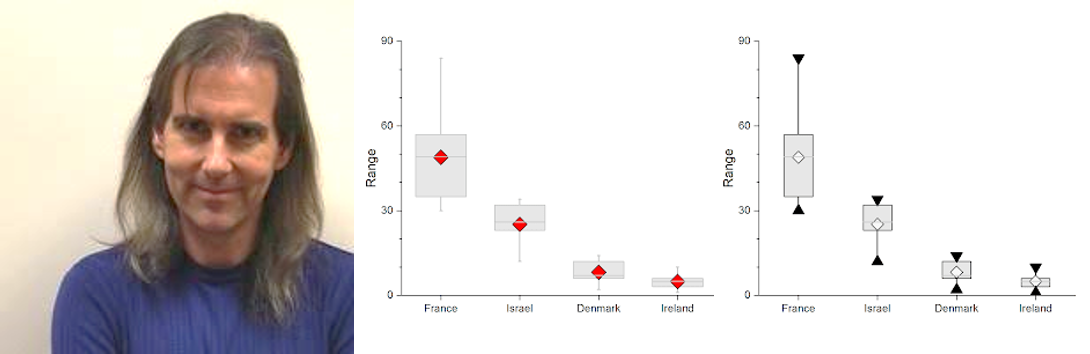
Zen Faulkes is a Professor at the University of Texas Rio Grande Valley. He studies brains, behavior and evolution in crustaceans. He also has a keen interest in design, and writes a blog and has a forthcoming book called Better Posters. He gave a short rundown on the “design brief” for a poster and why poster graphics differ from what you’d use in a paper focusing on standard graphs, and gave examples of how to use contrast to emphasize particular features. You can find his slides here. Follow him at @DoctorZen.
There was a lively discussion during and after the presentations. Have a look – you may find your questions are answered here!
PROGRAMS AND TOOLS
User friendly and free art tools? (ME)
- Prism GraphPad as a Kaleidagraph substitute (KG not compatible with OS Catalina) (Julia Frugoli)
- About KG: that’s why I kept the old computer, which does not/cannot run Catalina! (Patrice)
- For anyone who’s thinking about transitioning to free and open-source programs, I can personally recommend GIMP, Inkscape, and Scribus. They are fantastic alternatives to paid software and I now use them exclusively. GIMP is similar to Photoshop, Inkscape is similar to Adobe Illustrator, and Scribus is similar to Adobe InDesign or Microsoft Publisher. There are lots of video tutorials on YouTube for getting started. (Lisa Malins)
- I agree with you Lisa. I would add that if you have a question when using these free tools (I personally use Inkscape), don’t hesitate to google your question, you will easily find a discussion with someone that already asked the same question! Same remark for R error messages… (Titouan Sylvain Bonnot)
- Another good software is Vectornator for making vector images – interesting thing to remember –if you have your vector files saved as .pdf you can open them in Vector software and re-touch individual elements of the graph to comply with the journal / personal taste. That also works for R-graphs exported as pdfs! (Magda)
- Insisting on “free” can be limiting. I have consistently struggled to get the results with free software that I get with professional software that I paid for. Affinity (https://affinity.serif.com/) makes many graphics packages that are cheaper than the competition. If you are with an institution, check if your institution has site licenses for software: many have them, but they are not well advertised. (Zen Faulkes)
DRAWING CHEMICAL STRUCTURES
Any recommendations of tools for drawing chemical structures? (Merissa Tsai)
- Chemdraw is a good one (Melani Atmodjo)
- MarvinSketch is a free and easy to use software to draw chemical structures. If you can’t have the academic license for Chemdraw (Eva Knoch)
R/GGPLOT
What is the best place to start learning R? (Janet Slovin)
- I would recommend this for anyone who likes ggplot: https://www.r-graph-gallery.com/ (Nelson Lab)
- STHDA is a nice website that provides you R code and examples to generate different kind of plots using ggplot2. http://www.sthda.com/english/wiki/ggplot2-essentials. Also, this website describes how to perform statistics (Titouan Sylvain Bonnot)
- Hey Janet. I did an online course at Udemy from Kirill Eremenko. I really enjoyed it. (Rita Lima)
- This course is great for learning R and data visualization, and it is available for free https://www.edx.org/course/data-science-visualization (Liliana Lamig)
- R for Data Science by Garrett Grolemund and Hadley Wickham was helpful for me, and is available free online (Cassandra Baker)
- As somebody who’s about halfway through an R course, this chat is incredibly helpful! (ME)
- Thank you for delivering this talk. I really liked the display of data in the shape of a star in ggplot. (Debbie Swarthout)
- I have used some R for my project but didn’t know about faceting graphs. That info will be super useful in the future, so thank you! (Abigail Bell)
- You can find my slides on fig share >> https://figshare.com/articles/presentation/ASPB2020_workshop_Data_Visualization_presentation/12735227 (Magda)
- I started learning R using the book called “R in action” by Robert Kabacoff. I also really appreciate “ggplot2” book by Hadley Wickham. The good tactic to get yourself going is to get a graph / code from book / online resource and “hack it” to your own needs. Then save the R code you used, to then re-use. The more you “hack” the more you remember and progress in your research and in learning R J (Magda)
COLOR SCHEMES / COLOR BLINDNESS / ADA COMPLIANCE
Tips on Color Palette Choices for different types of figures? (Ran Zhou)
Recommendations for tools for ADA compliant figures (color selection etc..) (Leonore Reiser)
- ColorOracle is a great free software to install that stimulates different color blindness situations: http://colororacle.org/. It changes the color of your whole screen briefly to simulate how a color blind person would see it on their screen (Ahmet Bakirbas)
- https://colorbrewer2.org/ for selecting color. Has color blind safe choices and palettes for sequential vs. divergent vs categorical data. (J Ma)
- https://colorbrewer2.org/#type=sequential&scheme=BuGn&n=3 Takes care of picking colour combinations that are color blind safe (Eliana GV)
- This library in R called ggsci is delivering you the options to colourschemes that are journal specific – you can find more info on how to use them here >> https://cran.r-project.org/web/packages/ggsci/vignettes/ggsci.html (Magda)
- Also – good app to have on your phone / computer is SimDaltonism, where you can open a window and see how your figure / poster / whatever really looks to a people with different versions of colorblindness (Magda)
- Make your figure in greyscale! Alternately, after you’ve made your colour figure, convert it to greyscale in your editor. If it is still legible in grey, you’re almost certainly good. (If you think grey is limiting, black and white photography still exists.) (Zen Faulkes)
- Expanding a bit more: I remember the days when hatching was preferred over colors, because you had to think of how your figures would look when photocopied. All black is not great, and one can use shades of gray to convey information like dosage of a chemical, or an allelic series. Plus, some journals still ask you to pay (and pay more) for color figures. (Patrice)
- Even though not everyone will have a color printer, they had a computer/tablet from which to access the PDF, I think. But that is something to consider too: accessibility to computers and printers use to disseminate your science. (Patrice)
Patrice, should we still think how our Fig will look when printed in black and white? (Katarzyna Glowacka)
Second Katarzyna’s question. Is B&W/greyscale relevant still? (Patricia Lopez)
- B&W personal answer: Some journals and especially books still print in greyscale unless you pay for color. I also find it useful to consider greyscale because if your figure works in greyscale it is definitely color blind compliant (Rebecca Roston)
- Patricia: very often, black/white or gray scale is better than color. With that said, I would use grayscale rather than black, because it is little too stark for me (Patrice Salome)
BIORENDER
I would love to get opinions on the use of BioRender to generate figures – pluses and minuses? Related to the BioRender question, is re-using visual elements considered self-plagiarism? (Charlie Anderson, Assoc Prof, Penn State)
- BioRender is great for making summary figures and schematics, not sure for other purposes. You can also download all components separately and use them during (ppt) presentations for animations to build up your concept/mechanism etc. To see this last part in action, check in to my talk tomorrow 😉 (Sjon Hartman)
- Charlie: for now, I am reusing elements for figures specifically for the Plant Cell, so I think these are safe. I think using the same elements across different articles makes more sense to me than changing your visual language from one paper to the next. (Patrice Salome)
- Expanding a bit here too: the elements I am reusing are things like gene cartoons with their promoters, phytohormone structures, the way I show protein degradation, and a cartoon of the 26S proteasome. I was not talking about reusing a data plot or a picture of a plant. Pictures are so easy to take again (well, at least they used to be until recently…), it is so much easier to choose another picture (so take several!).
- BioRender has a free license and a paid license and the permissions are different for the two forms. (Blake Meyers)
- Patrice: is it a copyright violation to use biorender or Mind The Graph figures in a paper? (Liliana Lamig)
- I believe you need to mention the use of BioRender in the legend. (Patrice Salome)
- From the BioRender page: the free plan does not include permission to publish in scientific journals, but the individual plan ($35/month) does. Maybe your Institution has a subscription, so you don’t have to pay. (Patrice)
- Patrice is correct: you must credit BioRender. You can say “made in part with BioRender,” if you used other parts not from BioRender. I made a figure recently using some images from BioRender. (Anne Rea)
- I have played with BioRender a bit. Its big advantage is that it provides you with standard icons and templates. But one thing to be aware of when you use templates is that you end up with a certain “sameness”: your figures look like everyone else’s figures. (Zen Faulkes)
- And again: I would not reuse a data figure from one manuscript to another. If you used the same control for two different manuscripts, that might be ok. But I would probably just pick another representative experiment. (Patrice)
POSTER DESIGN
Zen, what are your thoughts on the poster format with the big summary statement in the middle? (Ira Herniter) – (Note – this question is in reference to a poster format recommendation that “broke the internet” about a year ago – with a large central panel with just a very short summery).
- The YouTube video: https://www.youtube.com/watch?v=1RwJbhkCA58 (Tanya Berardini)
- Mike Morrison’s poster design (which he called #betterposter on Twitter, not to be confused with my blog Better Posters) is made for a very specific purpose: to be able to walk through the entire auditorium and absorb all the “take home” messages (a “core dump” of a poster session). The format is very good for viewers who share that goal. But that is not everyone’s goal! Some viewers just want to see a few posters. So many people hate the format. Also, many people don’t understand the design principles at play in the format. So when they tinker with it, they create new problems. (Zen Faulkes) (Note – read more here)
Would you say your poster tips/rules are also true for oral presentations? (Sjon Hartman)
- Generally, yes. But oral presentations are more forgiving than posters, because nobody flips through your slide deck before deciding to sit in on your talk. Viewers have usually committed to sitting in the room through the talk before it starts. And you are there to guide them through complex slides. (Zen Faulkes)
- I usually have 1-2 simple panels in talks. I tend to talk a lot, so I can only go through so many slides. And I usually follow the motto “less is more”: pick a story, and explain it well. No point in presenting everythin you have ever done and lose your audience 10 minutes in! (Patrice)
This goes back to the discussion of different figures for different settings. I understand this presentation as: Simple for capturing audience attention, more complicated for publication. I ask in publications attention is not needed? (Patricio Perez Henriquez)
- Attention matters for journal articles, too, and good graphic design helps in both situations. But most people aren’t trying to read journal articles while walking in a crowded room trying to decide which to read before all the journal articles are removed after a couple of hours. (Zen Faulkes)
Zen: Can you have too much text on a poster (Ruth Ndathe)
- Yes
Any guidance on font size for different poster sizes? (Andrew Egesa)
- As big as possible! Most poster makers want to go small as possible to fit more things on the board, but this causes problems for people whose eyesight is not great. The Americans with Disabilities Act (ADA) standards recommend text about 66 points for signs viewed from less than 6 feet. Many parks and museums aim for text around 100 points for signs read from 2 meters. I am not saying those sizes are necessary for a conference poster, but I often see posters using text less than half that size. (Zen Faulkes)
- For posters, I do not go smaller than 18 point, usually I stay around 24 point fonts. (Patrice)
Zen: I actually do not seem to be drawn to the biggest text on anything – I often do not notice titles – I see, perhaps, the second-largest font, or even the very small font, first. What is up with that?!
- Titles might be above your eyeline, too high to catch your attention. Different people are different! This does mean, alas, that no design can be perfect for everyone. (Zen Faulkes)
Any websites on poster design? (Mehran D)
- Check out http://betterposters.blogspot.com/
- https://colinpurrington.com/tips/poster-design/ (Zen Faulkes)
GENERAL DESIGN QUESTIONS AND ANSWERS
- Highly recommend Edward Tufte’s books https://www.edwardtufte.com/tufte/ (Nancy)
Can you comment on using the same figures for different venues: publications vs. talks?
- I think figures for publications can be much more complex, and for presentations I usually try to simplify them – as in – maximum three panels of a figure per slide (and the main conclusion as slide title) – a good example is in Rule 3 of paper “Ten simple rules for better figures” (https://journals.plos.org/ploscompbiol/article?id=10.1371/journal.pcbi.1003833 ), where the author advice to adapt figure for different media – mainly to differentiate between presentation and publication where you have different length of interaction with the figure (Magda)
- I find often that seeing the multi-panel ’publication’ figure in a presentation is overwhelming but that type of reuse seems to be common. (Tanya Berardini)
- Time spend optimizing figures for different venues is time well spent! Figures made for journals that are dumped onto a slide or poster are often the wrong proportion, unreadable (text too small), and uninterpretable (because people leave out figure legends with crucial info). (Zen Faulkes)
To Patrice: I like to put representative pictures of plants in the figures but sometimes the space is not enough. Do you have any recommendation about when it is convenient trying to make more visual/real your data plots? (Facundo Romani)
- It becomes a question of prioritization of figure elements: I find that phenotypes are easier to understand with representative images. You can then have one quantitative graph next to the pictures, and move the rest to supplemental. Or show the images as supplemental material. If the graphs and pictures include 10-15 different genotypes or conditions, that’s probably too much and you might think about parsing out your conditions/genotypes (Patrice)
How do we feel about figure captions that are not on the same page as the figure? — I, personally, am not a fan! (Mehran D)
- “Put information at the point of need” is a good general rule in graphic design. This means that it can be very helpful to put information in the graph instead of a figure legend. For example, I am always asking poster presenters, “What do your error bars show?” It’s not on the graph, and they haven’t include a figure legend. Putting it in the axis label means the information stays with the graph. (Zen Faulkes)
- I think in the case of really large figures, which are sometime necessary, this is the necessary evil. (Magda)
- As a science editor, I’ve asked authors to split single figures into two because the one figure was just too big. (Patrice)
Many times, we see that several papers especially review papers in the same field have very similar figures. I wonder to what extent are illustration adaptations acceptable? (Merissa Tsai)
- Copyright is a tricky subject. If you want to reuse a figure exactly as published, try the Copyright Clearance Center (https://www.copyright.com/). If you want to redraw a figure, there are websites (https://apps.automeris.io/wpd/) and apps (Date Thief) that allow you to capture data from graphs so you can replot it. (Zen Faulkes)\
- Some journals actually use professional illustrators for their figures (I think Nature Reviews does that), so then there is no problem with copyrights. And if someone came up with a good summary display, why not learn from them and use the same elements? I would not have a problem with that. (Patrice)
Patrice: Is there an upper limit for dpi? (Maleana Khoury)
- From my limited experience – I think there is no point in going beyond 300 dpi with images. But best practice is to save all your figures as pdf’s because that will allow you to rescale them infinitely, as they are the vector style images 🙂 (Magda)
- I think it depends on the figure: for line drawings only figures (so vector-based), increasing resolution will not change the crispness of the lines, as Magda wrote. For images though (plant pictures, microscopy images), journals will want to see at least 300 dpi. Three important points here
- resolution does not mean anything unless you also know figure size. If you saved your figure at 300 dpi but the size of the image was 1 inch, there won’t be that many pixels.
- With the size issue in mind, you should think about the final size of the image in the figure. Assuming that you saved your image in raw file (for plant pictures at least), you should then make a copy of the image and then adjust the resolution and size to get a final resolution of 300 dpi at the size you want the image to be.
- One way to increase the resolution of an image is to make it smaller when you position it in the figure. The number of pixels will be the same, but you are changing the denominator. Beware about copying an image and dropping it into your graphics software: oftentimes the image will become huge because some graphics softwares change the resolution to 72 dpi. You should then bring the image back to the size you want, rather than resizing all other elements in the figure (Patrice).
Can you please elaborate on the standard error bars bit (Mavis)
- Not sure what this question is referring to, but I will say: if you have a graph with error bars, please indicate what the error bars in the axis label! Error cars can show standard deviation, standard error, confidence intervals, among other things. (Zen Faulkes)
- You should only add an error bar when the values you measured follow a normal distribution. This is impossible to determine with n=2 (well, it’s still hard with n=3, but that’s one of the compromises we tolerate). Showing the entire distribution of values (and the mean perhaps) but not the error bar (SD or SEM) would be a “safe” option, as you do not assume normality, you just show everything. You can also decide on whether to use a box plot representation or a violin plot or a dot plot; all are options, depending on the number of sampled values (Patrice)
While on the topic of using the same figure multiple times, I am curious what all speakers think about redrawing? (Merissa Tsai)
- I’ve redrawn figures for various projects. As mentioned in another question, there are websites (https://apps.automeris.io/wpd/) and apps (Data Thief) to extract values from graphs.
- For now, I am reusing elements for figures specifically for the Plant Cell, so I think these are safe. I think using the same elements across different articles makes more sense to me than changing your visual language from one paper to the next. (Patrice Salome)
- If a data figure: don’t. If a cartoon, then it’s fine. (Patrice)
I really think a workshop on the Copyright will be great (Ran Zhou)
THANKS ETC.
- This has been hugely informative thus far — thanks (Mehran D)
- Very informative, thanks (Mavis)
- Thanks! (Ran Zhou)
- Yes, really good so far! Thanks (Sjon Hartman)
- I just started my data analysis and this has been the best workshop for me so far! (Modesta Abugu)
- Thank you. This was really useful! Great display of designing figures. (Debbie Swarthout)
- @Zen, can I have a copy of your presentation to show our grad students in our presentation preparation class? Thank you! Amazing! ( Rebecca Roston)
- Amazing! (Cassano)
- Well done!! (Ava)
- Fantastic presentation!! (Hao)
- Loved your talk @Zen you are awesome (Sujina Mali)
- Please can we get a copy of these slides? Super amazing talks! (Modesta Abugu)
- Thank you Zen. Really neat communication skills. Great use of this Powerpoint template. (Debbie Swarthout)
- Really love the format of this entire workshop/presentation! (Maleana Khoury)
- Zen, great pointers…Thanks! (Susan)
- Thanks to all the presenters in this workshop. Everyone did a super job! (Debbie Swarthout)
- Great session! fantastic speakers! thank you! (Verena Tomasini)
- Thanks to all the speakers Drs. Julkowska, Salomé and Faulkes, and the organiser Dr. Ivan Baxter for the great session. (Akshaya)
- Loved this session! Thanks! (Rita Lima)
- Great session, thank you! (Demissew Teshome)
- :Great workshop! Thank you very much!! (Mariela Monteoliva)
- Great Workshop! (Boris Alladassi)