
MVApp flies its flag to the challenging frontier of multivariate data analysis
Commentary by Maria Papanatsiou
We live an era where omic approaches are essential to decode scientific hypotheses. Indeed, technological advances have accelerated science, resulting in a plethora of insights. During the past decade, the plant science community has profited from using large and high-throughput phenotypic platforms to characterise multiple traits across time and environmental conditions, enabling the in-depth examination of genotype-to-phenotype interactions. However, such forward moving experimental approaches require extensive data analysis, which can be very challenging. Are we ready to tackle this vast amount of phenomic data? Do we have adequate statistical literacy to properly interpret our results? And do we have standardized methods ensuring the accessibility, reproducibility, and transparency of our data?
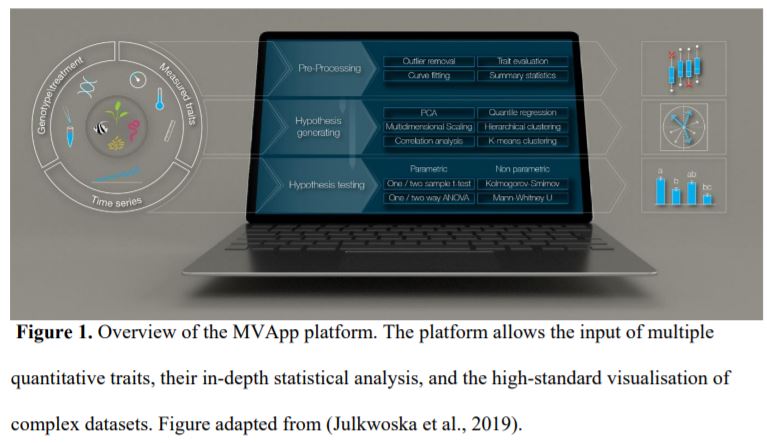
Although we have tools allowing the detailed analysis of, for instance, RNA-seq (McCarthy et al., 2017) and metabolomic (Xia et al., 2015) datasets, we lack a streamlined method of analysing phenomic data. Julkowska et al. (2019) undertook this challenge by developing the MVApp, a platform based on R-functions that does not require a priori knowledge of statistics and programming. They developed a user-friendly, open source, and modular platform that is suitable for any biological system, to accommodate the evolving needs of the scientific community. The authors demonstrated their conceptual design for MVApp by following the growth and performance of nine Arabidopsis accessions subjected to control and salt treatments. Their article demonstrates the key tools of MVApp, and it can be used as an alternative README file to understand the potential of the MVApp platform to describe and interpret biological datasets (Fig. 1).
 Finding the mathematical model that will best describe a dataset is often an overwhelming task. For instance, deciding on the optimal regression model to fit a dataset usually requires multiple iterative testing and the user making decisions about which tests to perform. Furthermore, we often encounter data points that do not follow the trend of a response, whether these correspond to individual samples or time-points. Excluding such outliers can lead to missing important information (Altman and Krzywinski, 2016) and can yet again involve personal judgement. Thus, how can we ensure data transparency and reproducibility if such statistical approaches rely on subjective biases? MVApp circumvents this problem as well as time-consuming manual fittings by testing in parallel all the possible and meaningful mathematical models to provide the best accurate description of a dataset. In line with these properties, MVApp summarizes each analytical method with compiled graphical outputs that in turn help the user understand the logic of choosing one model over the other, and therefore strengthen his/her statistical literacy.
MVApp provides a range of graphical outputs, including boxplots, bar plots, violin plots, or data plots, justifying the developer team’s motto of “glittery” data analysis, as well as the standard sequence of statistics like normality distribution and equal variance. Using popping message boxes, MVApp consults the user on the type of statistical test to be used (i.e., parametric or non-parametric) and on the interpretation of p-values. For example, in the dataset analysed by Julkowska et al., MVApp revealed that the genotype-to-environment interactions (GxE) were more pronounced when evaluated for rosette growth than for photosynthetic efficiency. Additionally, two-way ANOVA identified temporal dependencies of GxE, with discrepancies in these occurring after day four for rosette growth and day one for chlorophyll fluorescence. Through correlation analysis, MVApp revealed a positive relationship between photosynthetic quantum yield and plant size. Analysis of such phenotype-to-phenotype relationships validated that chlorophyll fluorescence can be used as a proxy for plant performance under stress conditions. These findings were further validated using the method of hierarchical clustering that generated a range of visual outputs and further highlighted the interplay among phenotype, environment, and genotype. Likewise, this in-depth analysis identified some accessions with small rosettes but high photosynthetic efficiency that did not follow the general trend, begging for further investigation of the mechanisms underlying these plant responses. Thus, MVApp can not only validate hypotheses but can also generate new ones.
But how do we treat multidimensional phenotypes such as plant growth and yield? These two traits cannot be treated as single entities, but they can rather be the endpoints of a medley of quantitative traits. Correlation analysis can help reduce a phenotype’s dimensionality. MVApp offers two tools to approach multivariate analysis of phenotype issue, principal component analysis (PCA) and multidimensional scaling (MDS). PCA determines the minimum number of dimensions defining a phenotypic variance (Lever et al., 2017) and is widely used to dissect complex phenotypes (Saito et al., 2004; Zhang et al., 2016). A useful property of MVApp is its intuitive environment that allows the user to understand, explore, and interpret the contribution of each principal component to the phenotypic output. Alternatively, MDS allows the evaluation of similarities and dissimilarities among objects, for example among replicates or among different treatments (Zhu and Yu, 2009; Hout et al., 2013, Fukushima et al., 2014). Both PCA and MDS can reveal the most meaningful and interesting traits associated with a phenotype. Additionally, to assess which traits are the major contributors under a given environmental or genotypic context, Julkowska et al. (2019) incorporated quantile regression analysis, which provides a more robust and comprehensive analysis of variables. The authors showed that in light-adapted plants the properties of the photosynthetic machinery such as electron transport rate and quantum yield were tightly correlated with each other, having substantial influence on other traits and favourably contributing to plant size.
Last but not least, MVApp can infer estimates of heritability to better design forward genetic approaches. For example, MVApp revealed that traits such as quantum yield, non-photochemical quenching, and rosette area had the highest heritability score, especially under control conditions, although the genetic basis of these traits remains to be elucidated.
Julkowska et al. (2019) have advocated for the need of a standardized method of analysis to tackle the large amount of phenomic information generated by the plant scientific community, and they fill this gap by introducing the MVApp. Not only does this platform offer the “statistical” confidence scientists need to properly interpret their results, but it also allows the exploration of hidden relationships among genotypes, the environment, and phenotypes. To make the MVApp platform even more attractive, the authors cleverly designed it to have a modular nature, encouraging input from the scientific community (https://github.com/mmjulkowska/MVApp/blob/master/CONTRIBUTING.md). Apart from its analytical power, the hypothesis-generating capacity of MVApp will allow scientists to process complex datasets and develop new scientific hypotheses.
Acknowledgements:
I would like to thank Dr. Magdalena Julkowska for providing the illustration of Figure 1, which was produced by Ivan Gromicho, scientific illustrator at KAUST.
References:
Altman, N. and Krzywinski, M. (2016) Analyzing outliers: influential or nuisance? Nature Methods 13, pp. 281–282
Fukushima, A., Kusano, M., Mejia, R. F., Iwasa, M., Kobayashi, M., Hayashi, N., Watanabe-Takahashi, A., Narisawa, T., Tohge, T., Hur, M., Wurtele, E. S., Nikolau, B. J., Saito, K. (2014) Metabolomic Characterization of Knockout Mutants in Arabidopsis: Development of a Metabolite Profiling Database for Knockout Mutants in Arabidopsis. Plant Physiology, 165 (3), pp. 948-961
Hirai, M. Y., Yano, M., Goodenowe, D. B., Kanaya, S., Kimura, T., Awazuhara, M., Arita, M., Fujiwara, T., Saito K. (2004) Integration of transcriptomics and metabolomics for understanding of global responses to nutritional stresses in Arabidopsis thaliana. Proceedings of the National Academy of Sciences 101 (27), pp. 10205-10210
Hout, M. C., Papesh, M. H., Goldinger, S. D. (2013) Multidimensional scaling. WIREs Cogn Sci, 4, pp. 93-103
Julkowska, M. M., Saade, S., Agarwal, G., Gao, G., Pailles, Y., Morton, M., Awlia, M., Tester, M. (2019) MVApp – Multivariate analysis application for streamlined data analysis and curation. Plant Physiology
McCarthy, D.J., Campbell, K.R., Lun, A.T.L., Wills, Q.F. (2017) Scater: pre-processing, quality control, normalization and visualization of single-cell RNA-seq data in R. Bioinformatics 33, pp. 1179–1186
Xia, J., Sinelnikov, I.V., Han, B., Wishart, D.S. (2015) MetaboAnalyst 3.0-making metabolomics more meaningful. Nucleic Acids Research 43, pp. W251–W257
Zhu, C., & Yu, J (2009) Nonmetric multidimensional scaling corrects for population structure in association mapping with different sample types. Genetics, 182(3), pp. 875–888
Figure Legends:
Figure 1. Overview of the MVApp platform. The platform allows the input of multiple quantitative traits, their in-depth statistical analysis, and the high-standard visualisation of complex datasets. Figure adapted from (Julkwoska et al., 2019).