Introduction to Graphic Design in Research
In plant biology, like any scientific discipline, the ability to efficiently express complex data and ideas is essential both for building knowledge amongst specialists and for disseminating information to the broader public. Graphic design skills have become increasingly important in this regard, as they enable scientists to create clear and visually appealing graphics, diagrams, and charts that convey scientific concepts efficiently.
For instance, graphic design skills are useful for generating deliverables like scientific posters and presentations, which, when well-designed, can facilitate collaborative research by communicating complex technical information. For more general audiences, graphic design skills can be used to create infographics, animations, and other visual aids that can make scientific concepts more engaging and accessible to non-experts.
Thus, by incorporating design principles into their research, scientists can create visually appealing graphics, diagrams, and charts that engage viewers and are easy to understand. This can extend the impact of their research, promote scientific literacy, and facilitate collaboration within and across disciplines.
Types of research materials in which design can be applied
Several types of graphic materials are commonly used in science to illustrate or communicate data and discoveries, such as graphs, figures, and infographics, often within reports, posters, presentations, or webpages. Graphics in any of these forms benefit from applying the design principles that are conventionally used by graphic designers.
Modern graphic designers often consider 12 top principles, including some of Gestalt´s and Wertheimer´s principles (learn more in the Guberman, 2017 review). They are Contrast, Balance, Emphasis, Proportion, Hierarchy, Repetition, Rhythm, Pattern, White Space, Movement, Variety, and Unity. You will find a description of each here (Toptal website).
Below we provide examples of how these design principles might be applied to these scientific deliverables.
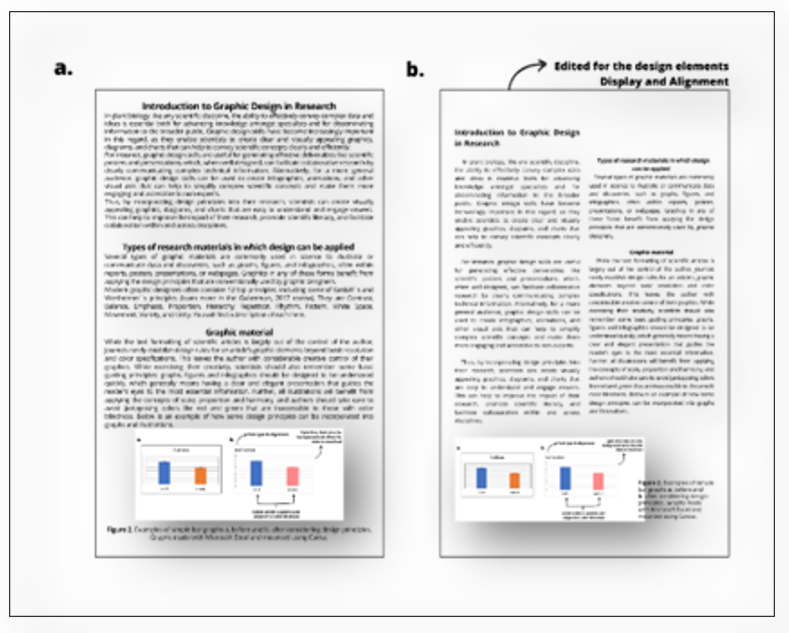
Figure 1. Samples of texts. a. before and b. after considering design principles. Microsoft Word text documents, mounted using Canva.
Text material
Although the text content of a scientific article is typically formatted in accordance with the journal’s requirements, creating other types of scientific text materials, such as proposals, projects and reports requires attention to the design elements of readability, cleanliness, structure and alignment. Figure 1 is an example of how you can incorporate some design principles into a plain text to enhance its visual effect.
Tip: Zoom out and observe the document from a distance to get a better sense of the initial impression it will make on the reader. Is the document visually neat, cohesive, and organized?
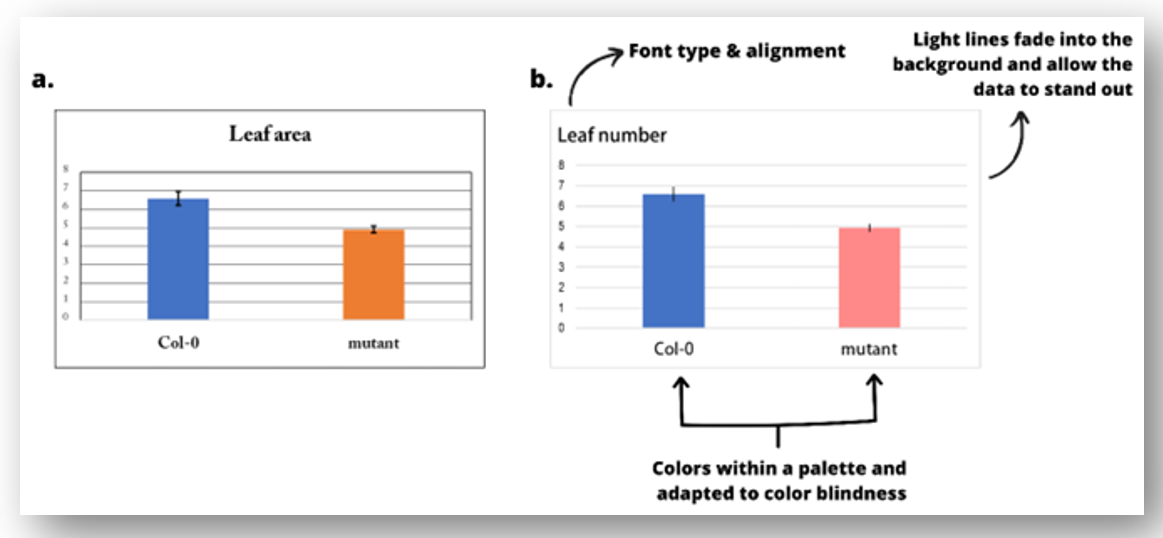
Figure 2. Examples of simple bar graphs a. before and b. after considering design principles. Graphs made with Microsoft Excel and mounted using Canva.
Graphic material
While the text formatting of scientific articles is largely out of the control of the author, journals rarely establish design rules for an article’s graphic elements beyond basic resolution and color specifications. This leaves the author with considerable creative control of their graphics. While exercising their creativity, scientists should also remember some basic guiding principles: graphs, figures and infographics should be designed to be understood quickly, which generally means having a clear and elegant presentation that guides the reader’s eyes to the most essential information. Further, all illustrations will benefit from applying the concepts of scale, proportion and harmony, and authors should take care to avoid juxtaposing colors like red and green that are inaccessible to those with color blindness. Figures 2 and 3 are examples of how some design principles can be incorporated into graphs and illustrations.
Tip: Once you develop an eye for design principles, it will be natural to make all your graphic designs in accordance with them. A great way to develop this intuition is by familiarizing yourself with well-designed graphics, like the infographics available at (Plantae Website).
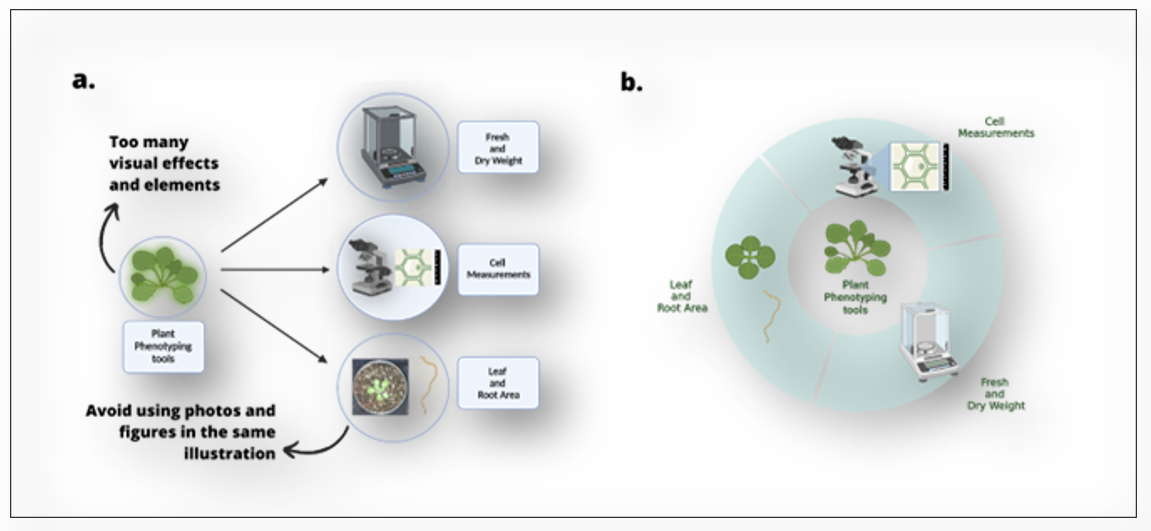
Figure 3. Examples of figures a. before and b. after considering design principles. Graphs made with BioRender.com and mounted using Canva.
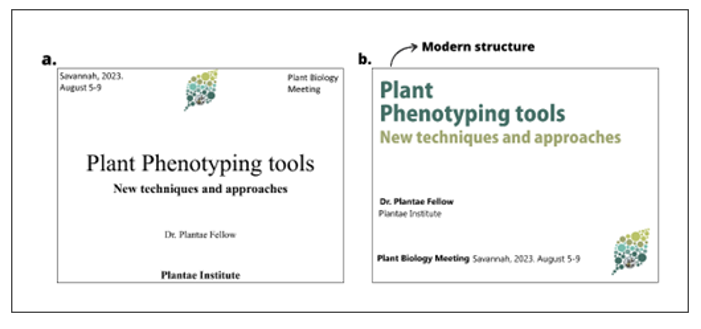
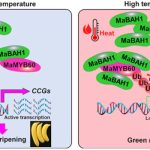
Figure 4.
Presentation
PowerPoint presentations are a classic format for presenting information in a visually appealing and organized manner. When developing a presentation, scientists may choose from a multitude of ready-made templates available online or may develop their own design. In either case, they should consider the impression their design choices make on the audience: not only will they affect the ease with which the audience receives the information, but they also may influence audience engagement and the perceived originality of their work (see Figure 4).
Tips: Use colors wisely – choosing one or two bold colors for your color scheme can help you to direct your audience’s attention and highlight important points.
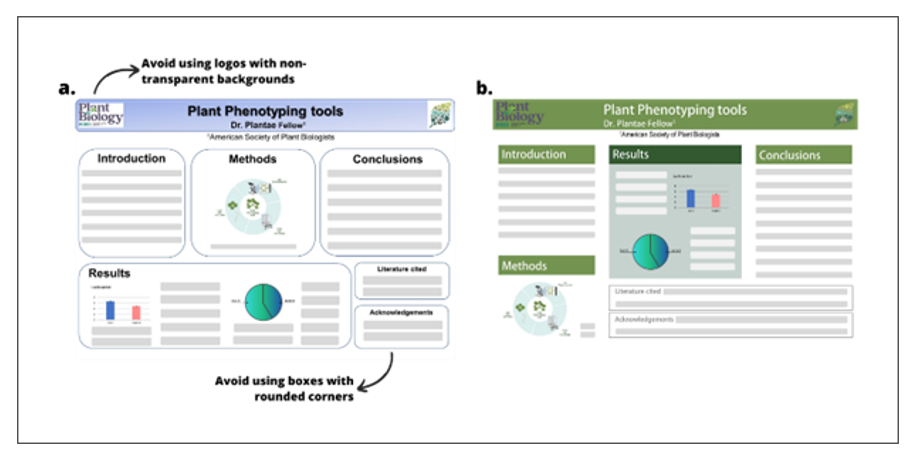
Figure 5. Examples of a poster template a. before and b. after considering design principles. Posters made with Microsoft Powerpoint and mounted using Canva. Graphs made with BioRender.com.
Posters
Scientific posters typically serve as hybrids between oral presentations and manuscripts, often to present preliminary scientific data in a semi-formal context like a conference or symposium. A well-designed poster can be a great tool in these settings for providing visual aids and emphasizing key takeaways to the audience. Alternatively, an overly cluttered or poorly designed poster can leave the audience lost or overwhelmed. Whether developing a poster from scratch or following a template provided by a research institute or university, authors should consider the design principles as they develop their posters, with an emphasis on simplicity and clarity (see Figure 5).
Tip: Consider splitting your poster’s text into two to four columns – this will make it easier to read from a distance.
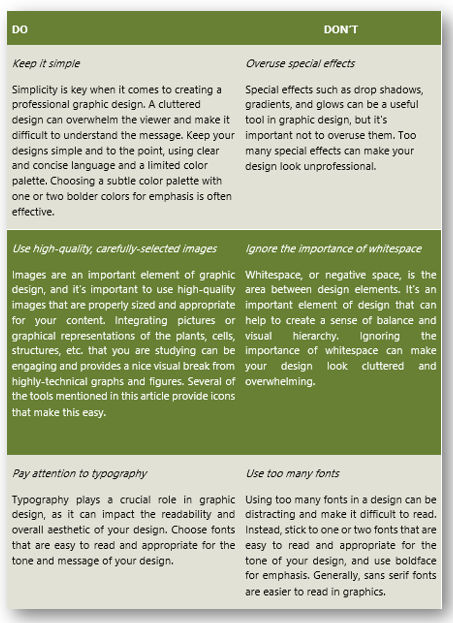
General Do’s and Don’ts
Becoming familiar with the conventional wisdom of graphic designers may be useful for novices seeking to craft effective graphics.
Useful resources for applying the design principles into research
BioRender.com: An intuitive online tool with thousands of ready-to-use scientific icons and templates. Biorender allows you to customize your illustrations, and it is especially useful for creating figures, infographics and posters. It is a paid-subscription software, though it offers a free version that does not allow users to freely publish the images they generate. Although many of the icons and templates provided can be customized by the user, some editing functions are limited (e.g. vectorizing or casting shadows in some images). This is a great and efficient tool for most practical purposes.
Inkscape: A free software especially designed for creating and editing images. This tool is most appropriate for generating new illustrations from scratch. Some users will not find it intuitive to use, but tutorials are available online.
Canva: A very user-friendly online tool full of pre-made resources that is especially apt for creating presentations, posters, infographics and social media material. Canva’s vast pool of beautifully designed templates can lend novelty and visual impact to your presentations. Though Canva can be used for free, an upgraded version offers many more features.
Tableau: A software dedicated to data visualization, especially graphs and infographics. The free version is limited to visualization of public data. Tableau is designed for business intelligence and data analysis, and can be useful for scientific data as well.
Adobe Illustrator: The leading professional tool for graphic design. It is a paid software with numerous editing and creative possibilities. Although not very intuitive, it is ideal for drawing and creating figures and presentations virtually without limitation, and a plethora of tutorials are available online.
Office package: A popular package especially for creating and editing texts, graphs, posters and presentations. Easy handling, it provides basic outcomes. The package offers default settings that usually need to be customized in order to provide a well-designed result.
R: A free software environment especially used for graphics. This is one of the best tools to create customized graphics with endless possibilities, but may present a learning curve as it requires some basic coding skills and familiarity with the program’s unique syntax.
AI: Artificial Intelligence (AI) tools have recently become more accessible and are used to accelerate the design process. Many emerging AI softwares can generate artistic illustrations or web interfaces, such as Jasper.ai, Designs.ai, Adobe Sensei, and Uizard.
Additional resources for:
- Creating a color palette: coolors, colorhunt.
- Choosing fonts: Googlefonts, Fontshare, DaFont, FontSquirrel.
- Icons: Icons8, Noun Project, Iconfinder.
- Images: pixabay, unsplash, pexels, freepik.
- Creating graphs: https://www.royfrancis.com/elegant-scientific-graphs-learning-from-examples.
- Designing posters: https://proofed.com/writing-tips/top-tips-research-poster/.
References:
- Guberman S. Gestalt Theory Rearranged: Back to Wertheimer. Front Psychol. 2017 Oct 11;8:1782. doi: 10.3389/fpsyg.2017.01782. PMID: 29075220; PMCID: PMC5641857.
- Chapman C. Breaking down the principles of design (with infographic). Toptal Design Blog. 2019 Sep 24 [accessed 2023 Jun 5]. https://www.toptal.com/designers/gui/principles-of-design-infographic
- Williams M. Communicating effectively with graphics. Plantae. 2016 Nov 6 [accessed 2023 Jun 5]. https://plantae.org/communicating-effectively-with-graphics-2/.
______________________________________________
About the Authors:
Maria Juliana Calderan Rodrigues is a Postdoctoral Molecular Biologist at Max Planck Institute and a 2023 Plantae Fellow. She is researching plant growth in model plants and tropical crops. Science strategic planning, management, and evaluation are also part of her expertise. You can find her on Twitter at @majucalderan
Annelise Vieira is an NSF Graduate Research Fellow at Cornell University and a 2023 Plantae Fellow. She has a penchant for writing, technical communication, and content creation. Her past and present research works have addressed questions in genetics, biochemistry, and physiology of horticultural crops.