Comparative Cell-Specific DNaseI-Seq Reveals Transcription Factor Binding Landscape in C3 and C4 Grasses
Nearly every aspect of growth, morphogenesis, physiology, and stress response is influenced by cell/tissue-type specific gene expression. Transcription factors (TFs) recognize cis-regulatory elements and signal transcription machinery for gene regulation, and the interaction between TFs and their target genes creates spatiotemporal patterns of gene expression. Accurate functional annotation of these regulatory sites is essential for a comprehensive understanding of gene regulation in a variety of cell types and under diverse conditions.
Burgess et al. performed DNaseI-seq analysis for the identification of genome-wide profiles of transcription factor binding sites (TFBS) in three different C4 grass species and the C3 grass B. distachyon. DNaseI-seq is a common technique used for the detection of accessible chromatin through the identification of DNaseI Hypersensitive Sites (DHSs). These data can also be used to generate Digital Genomic Footprints (DGFs), which enable the identification of underlying TFBS. In all four grasses, many more DHSs were present in genic sequences than promoters, and many DHSs and DGFs were found in exons. These sequences have been called “duons” because they play a dual role in both gene regulation as well as coding for the amino acid sequence of the protein (Reyna-Llorens et al., 2018).
 The use of the distinct cell-types—whole leaf and bundle sheath fractions—in C4 grasses allowed the study of TFBS in specific cell types, providing insight into the role of the chromatin landscape in the regulation of C4 photosynthesis. The authors note that while broad regions of accessible DNA (DHSs) are similar across the cell types, DGFs, which represent sequences bound by TFs, had much more variation. Using previously published RNA-seq data, the authors were able to investigate the relationship between cell-type specific gene expression and position of DHS/DGFs and found an association at some loci. For example, three colinear genes on chromosome 7 of S. bicolor showed differences in transcript abundance and TF binding sites between mesophyll and bundle sheath cells in C4 leaves that were associated with both differential DNA accessibility inferred from DHS peaks and fine-scale variations to TF binding identified through DGFs (see Figure). On a genome-wide scale, however, there was not a striking relationship between cell-type specific gene expression and TFBS. TF motifs from DGFs enriched in either of the two cell types in sorghum showed little differences in the abundance of the most common motifs. These results indicate that multiple other factors may also be involved in the regulation of cell-type specific gene expression in C4 photosynthesis.
The number of DGFs conserved and occupied by a TF decreased non-linearly with the phylogenetic distance, with sorghum and maize being the most similar in conserved and occupied DGFs. Comparing the three C4 grasses with the C3 grass B. distachyon, revealed 93 DGF conserved over more than 60 MY of divergence. However, the different origins of C4 in maize, sorghum, and S. italica may confound this estimation. Furthermore, the observed conservation between these grasses is likely an underestimation due to differences in sampling time employed in the study. Future studies are necessary to resolve the differences in TFBS between C3 and C4 plants, but the data generated here represents a significant and useful resource for the cereal genomics community.
Sunil Kumar Kenchanmane Raju
Assistant Features Editor
Michigan State University
REFERENCES
Burgess, S.J., Reyna-Llorens, I., Stevenson, S.R., Singh, P., Jaeger, K. and Hibberd, J.M. 2019. Genome-wide transcription factor binding in leaves from C3 and C4 grasses. Plant Cell https://doi.org/10.1105/tpc.19.00078.
Reyna-Llorens, I., Burgess, S.J., Reeves, G., Singh, P., Stevenson, S.R., Williams, B.P., Stanley, S. and Hibberd, J.M. (2018). Ancient duons may underpin spatial patterning of gene expression in C4 leaves. Proc. Natl. Acad. Sci. USA 115: 1931-1936.
FIGURE LEGEND
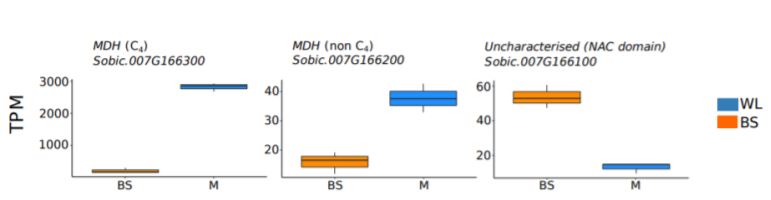
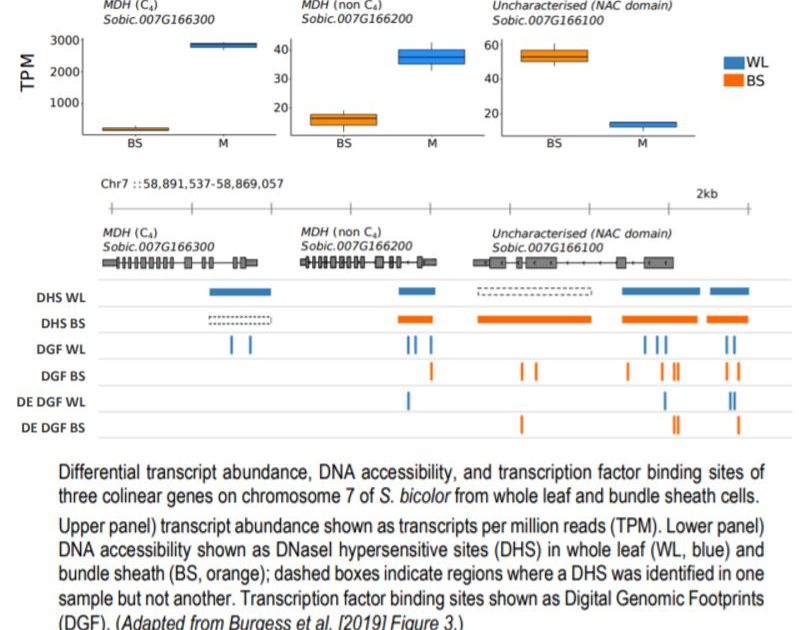
Differential transcript abundance, DNA accessibility, and transcription factor binding sites of three colinear genes on chromosome 7 of S. bicolor from whole leaf and bundle sheath cells.
Upper panel) transcript abundance shown as transcripts per million reads (TPM). Lower panel) DNA accessibility shown as DNaseI hypersensitive sites (DHS) in whole leaf (WL, blue) and bundle sheath (BS, orange); dashed boxes indicate regions where a DHS was identified in one sample but not another. Transcription factor binding sites shown as Digital Genomic Footprints (DGF). (Adapted from Burgess et al. [2019] Figure 3.)

