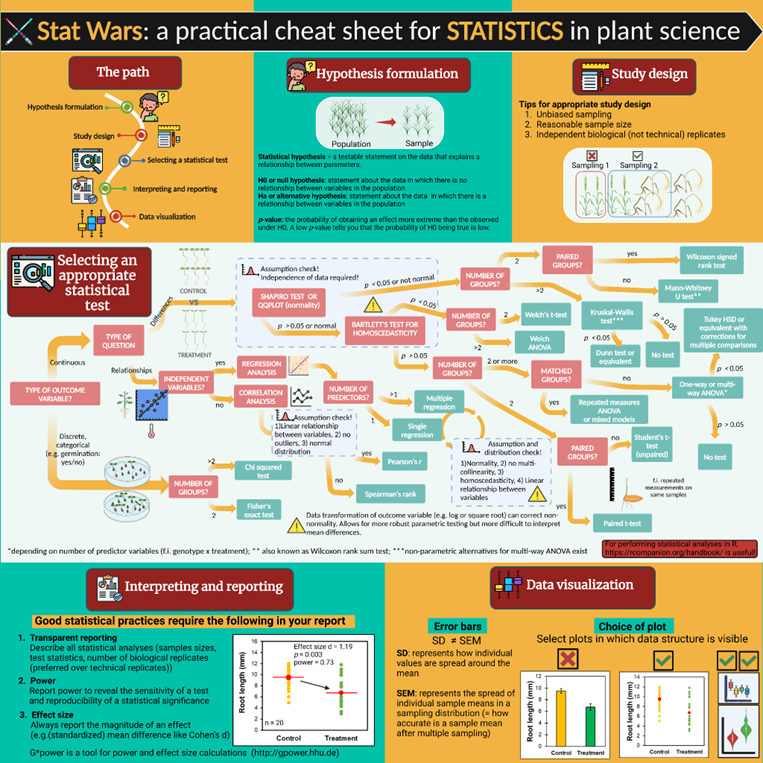
How to Choose a Suitable Statistical Method for Your Experiment
Introduction:
In plant science – as in most exact sciences – there are many experimental routes to answer specific research questions. These experiments can range from studying gene expression of plants under stress conditions to observing phenotypic traits like plant height or yield. To derive meaningful results from an experiment and enable proper interpretation of your datasets, applying proper statistical analyses is essential. Regardless of the type of experiment, choosing the right statistical method is critical for transforming raw data into valuable insights. The right statistical tools can reveal patterns, test hypotheses, and ensure that findings are robust and reproducible. In this infographic, we will explore how to select the appropriate statistical methods for plant science experiments, whether working with complex genetic datasets or straightforward phenotypic measurements. It is important to note that the statistical inference methods discussed are based on frequentist inference, which employs null hypothesis significance testing, p-value calculations, and the generation of confidence intervals. Other statistical frameworks, such as Bayesian inference, are also used in scientific research, with their own advantages and drawbacks, but are not the focus of this article. Furthermore, it is crucial to emphasize that the outcomes of statistical tests, like p-values, are informative but insufficient on their own for forming conclusions. Complementary considerations, such as effect size estimation, replication, and the use of alternative statistical methods, are essential to ensure robust conclusions from your analyses.
Conclusion:
Statistics may often seem like a complex addition to an already intricate research process, but its proper application is a powerful tool in the plant scientist’s arsenal. The right statistical methods not only enhance the reliability of your results but also reveal new insights that might otherwise be overlooked. It is crucial, however, to recognize that achieving reliable experimental results requires thoughtful planning before, attentive execution during, and thorough analysis after the experiment. As Ronald Fisher rightly noted, “To consult the statistician after an experiment is finished is often merely to ask him to conduct a post mortem examination. He can perhaps say what the experiment died of.”
As plant science advances with increasingly sophisticated experiments, understanding and applying the appropriate statistical tools will be key to pushing the boundaries of what we know about the natural world. The decisions you make today will drive the innovations of tomorrow.
Some free resources to learn more:
- R for Data Science: https://r4ds.had.co.nz/; R for Data Science” by Hadley Wickham and Garrett Grolemund is a great free resource for learning how to use R for statistical analysis. R is widely used in plant science research for analyzing data. The book covers data wrangling, visualization, and statistical analysis with R.
- EdX: Data Science for Plant Biologists; This free course on EdX (by UC San Diego) covers basic statistical analysis and the applications of data science methods in plant biology, helping you analyze complex datasets like those often found in plant science research.
- StatQuest with Josh Starmer; Josh Starmer has an excellent YouTube channel, StatQuest, where he explains statistical concepts in simple terms. While it’s not plant science-specific, his explanations of statistical methods such as regression, ANOVA, and hypothesis testing can be directly applied to plant science research https://www.youtube.com/user/joshstarmer
- “Introduction to Statistical Learning”; While this course is not plant-specific, it provides a strong foundation in statistical learning and machine learning methods that can be applied to plant science, Coursera (Free Courses)
- “Data Science for Everyone”; This course, offered by IBM, includes basic statistics and data analysis techniques, which can be applied to plant data, Coursera (Free Courses)

______________________________________________
About the Authors
Thomas Depaepe is a postdoctoral researcher at Ghent University in Belgium. He is fascinated by plant-environment interactions and is currently studying the role of local ethylene responses to guide plant growth during abiotic stress. He is passionate about teaching, equal rights, and science writing. In his free time, he enjoys cooking, good music and movies, is a full-time cat dad, and loves videogames. X: @thdpaepe
Kumanan N. Govaichelvan is a PhD student at Universiti Malaya, Malaysia and a 2024 Plantae Fellow. Coming from a rice consuming country, he believes that his current research project will help enhance crop breeding process and sustain food security. He also likes discussing philosophy, Kazuo Ishiguro novels and human evolution. You can find him on X at @NGKumanan.
Arijit Mukherjee is presently a final-year PhD candidate at the National University of Singapore, studying how plants and their extraordinarily diverse microorganisms influence each other’s functioning under nutrient deficiency. If he is not in the lab, you might find him playing football :). X: @ArijitM61745830


