Predicting adult complex traits from early development transcript data in maize
An enduring goal of biologists is to link variation in the genome to phenotype. The discovery of easily measurable genetic markers in the recent past has led to the identification of variants controlling different traits through linkage analysis. Subsequently, advances in high-throughput sequencing have allowed genome-wide association studies (GWAS) for the identification of hundreds of genetic variants affecting numerous traits. GWAS typically localizes to approximate genomic positions requiring further functional assays to narrow it down to causal variants. Thus, identifying all underlying variants and elucidating the mechanistic basis of complex traits remains a distant goal even today. Selection of superior candidates in a crop improvement program relies on accurate predictions, and epistasis and genotype-environment interactions potentially obscure such attempts. Incorporating models accounting for interactions within and across different biological levels could improve prediction performance. One way to accomplish this is by using gene expression data, which reflects, in part, the combinatorial effect of the genotype, environment (plasticity), and the genotype-environment interaction.
Researchers are often trained to design data-generating experiments to test their hypotheses. An alluring alternative that is gaining prominence is the use of existing public data to answer scientific questions. Azodi, Pardo and colleagues started on this project to challenge their advisor’s hypothesis that early development transcriptome data can be used in the prediction of adult-plant complex traits in maize (Azodi et al., 2019). For this, they leveraged publicly available phenotypic (Hansey et al., 2011), as well as genotypic and whole seedling transcriptome data (Hirsch et al., 2014) from a population of diverse maize inbred lines. They used multiple genomic prediction algorithms: two linear algorithms, ridge regression Best Linear Unbiased Predictor (rrBLUP), and Bayesian-Least Absolute Shrinkage and Selection Operator (BL), a non-linear algorithm; random forest (RF) and an ensemble approach (En: taking the mean predicted trait values from rrBLUP, BL and RF) for predicting adult-plant traits. Surprisingly, they found that early seedling transcriptome data was able to predict agronomically important adult-plant complex traits like flowering time, plant height, and yield better than predictions based on population structure alone.
 To evaluate the relative importance of transcripts over genetic markers for model prediction, the authors looked at the extent of overlap between important genetic markers predicted from genomic models with important transcripts predicted from those that were transcript-based. They found that transcriptome-based predictions were not merely based on genetic variations in the transcribed genomic regions, but these two data types captured different aspects of underlying phenotypic variation. One exception was the location of an important genetic marker located upstream of the transcript MADS69 (GRMZM2G171650), although the two are in linkage disequilibrium (Hirsch et al., 2014). Having established the usefulness of transcript data in trait prediction, Azodi et al., selected a set of 14 known flowering time genes and showed that RAP2 had a higher importance score based on genetic marker data but not from transcript data. In contrast, MADS69, MADS1, ZAG6, PEBP8, and PEBP24 had higher importance score based on transcript data alone (Figure). These results highlight the possibility that transcript levels of benchmark flowering time genes are more likely to be associated with trait (flowering time) than genetic variation at or near these genes. It is possible that these essential transcripts impact processes in earlier developmental stages that influence flowering time in adult plants.
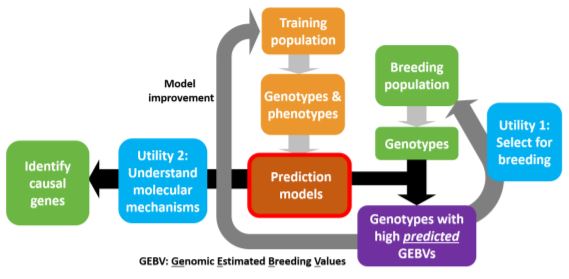
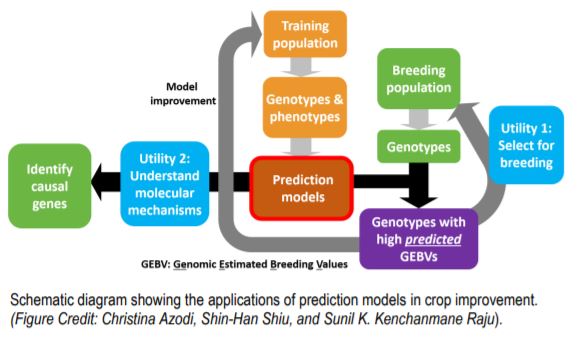
Variability in gene expression is controlled by intrinsic genetic variation and environment-dependent factors. While it is still challenging to associate identified genetic markers of large and small effects back to a gene, transcript level information is inherently associated with the gene and thus crucial for understanding the regulatory basis of trait variation. Using transcriptome data for trait prediction has multiple advantages over genomic models. First, expression differences are more interpretable biological units than sequence polymorphisms, and secondly, the lower total number of genes substantially reduces the multiple testing burden compared to sequence polymorphism-based predictions. Therefore, the approach described by Azodi et al. is complementary to genetic marker-based prediction and identifies gene expression-trait associations that are not explained by genetic markers. Not only does this help in selection of superior breeding lines, but also enhances our understanding of the mechanistic basis of variant-trait association (see Figure).
Sunil K. Kenchanmane Raju
Affiliation: Department of Plant Biology, Michigan State University.
kenchanmane@gmail.com
ORCID: 0000-0001-8960-094X
Phenotypic and genotypic information from the training dataset is used in estimating the parameters to build the model. The model can be used to predict phenotypes in a breeding population based on the genotypic data. These prediction models also aid in the understanding of the mechanisms controlling the trait with the identification of causal genes.
REFERENCES
Azodi, C.B., Pardo, J., VanBuren, R., de los Campos, G. and Shiu, S.H. (2019). Transcriptome-based prediction of complex traits in maize. Plant Cell doi: https://doi.org/10.1105/tpc.19.00332.
Hansey, C.N., Johnson, J.M., Sekhon, R.S., Kaeppler, S.M. and Leon, N.D. (2011). Genetic diversity of a maize association population with restricted phenology. Crop Sci. 51: 704-715.
Hirsch, C.N., Foerster, J.M., Johnson, J.M., Sekhon, R.S., Muttoni, G., Vaillancourt, B., Peñagaricano, F., Lindquist, E., Pedraza, M.A., Barry, K. and de Leon, N. (2014). Insights into the maize pan-genome and pan-transcriptome. Plant Cell 26: 121-135.